How To React As People Lose Their Heads In Extreme Market Uncertainty
Authored by Dan Rasmussen via Verdad,
We are in the midst of a significant market drawdown. These types of market panics have historically happened about once every decade, with this being the sharpest sell-off in the S&P 500 since 2009.
As people around us are losing their heads, we find it helpful to pause and reflect on what happened in previous market crises. Inspired by the pioneering work of Daniel Kahneman and Philip Tetlock, we believe that relying on base rates and historical probabilities is a superior guide to decision making than relying on stories or expert judgment.
We completed a nearly two-year study on crisis investing earlier this year, so we have spent a significant amount of time understanding the dynamics of historical sell-offs. Here is some data that we hope will help you navigate this volatile market.
The first question you’re probably asking is: how far will the market drop, and how long until the market bottoms? Our research found that over the last 50 years, when the S&P 500 has fallen this far, total losses have ranged from 27% (1982) to 57% (2009). Historically, when the S&P 500 has fallen 20%, the time it has taken to reach the absolute bottom has averaged about six months and ranged from one month (the 1987 flash crash) to 18 months (2000–2002).
Will the market recover? How long until the S&P 500 is back to breakeven? The US market has fully recovered from every historical market panic. In 1982, the market fully recovered in only five months. After the 2008 crisis, it took until early 2012, or about three years, to fully recover. The speed and depth of the drop has not historically correlated to the speed of the recovery.
For those with cash to invest or assets to deploy, what has historically been a good strategy for investing during these crises? We recommend reading our full report, Crisis Investing, for an in-depth look at historical crises. Our report looks at times when high-yield spreads rose above 6.5% (as they did last week).
But we also wanted to look specifically at times when the S&P 500 has fallen 20%, as it has this year (a different definition of a crisis than that used in our report). In the below tables, we show the 12- and 24-month returns for the four broad categories of US stocks as defined by Ken French.
Figure 1: 12M Returns Starting 3 Months from a 20% Drop in the S&P 500

Our research shows that the returns on all categories of US equities were strong, and losses were rare. Small stocks outperformed large stocks. Small value outperformed small growth. The returns of large growth and large value were relatively indistinguishable. What about over 24 months?
Figure 2: 24M Returns Starting 3 Months from a 20% Drop in the S&P 500

Over the full 24-month period, returns remained very strong, with small value earning positive returns in 100% of 24-month periods and having the highest absolute performance of these four categories. Small growth performed the next best, then large value, with large growth being the worst performer. Notably, large growth is the largest component of the S&P 500 indices, and the best-performing stock category over the past decade, and thus tends to be over-represented in investor portfolios.
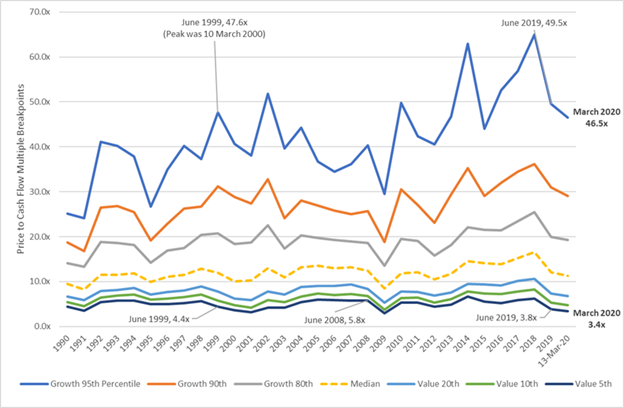
We believe the differential between the performance of small value and large growth could be even more extreme in this cycle. Our research suggests the median of the cheapest decile of US stocks trades at 3.4x cash flow, roughly 22% cheaper than the summer of 1999 and 42% cheaper than the summer of 2008.
Large growth stocks, in contrast, trade near 1999 levels and at much higher valuations than the summer of 2008.
Figure 3: US Equity Market Valuations over Time

It’s easy to lose sight of those big valuation discrepancies when focused on daily stock movements, but, historically, valuations have been a signal of future returns.
We know these are turbulent times, and we hope that this research will help you make good decisions in the midst of uncertainty. Please do not hesitate to reach out if anyone on our team can be helpful. We are happy to talk with you, your investment committee, your clients, or your family about our research on crisis investing if we can be of help.
Tyler Durden
Fri, 03/20/2020 – 08:00