How COVID-19 May Move Markets From Here
Authored by Patrick Hill via RealInvestmentAdvice.com,
As the pandemic drives markets to the 2018 lows, certain relationships in trends between the markets and the COVID-19 virus are evident. As social distancing increases, markets continue to fall. So, by looking at the expected breakout levels of the virus, we can assess possible market reactions.
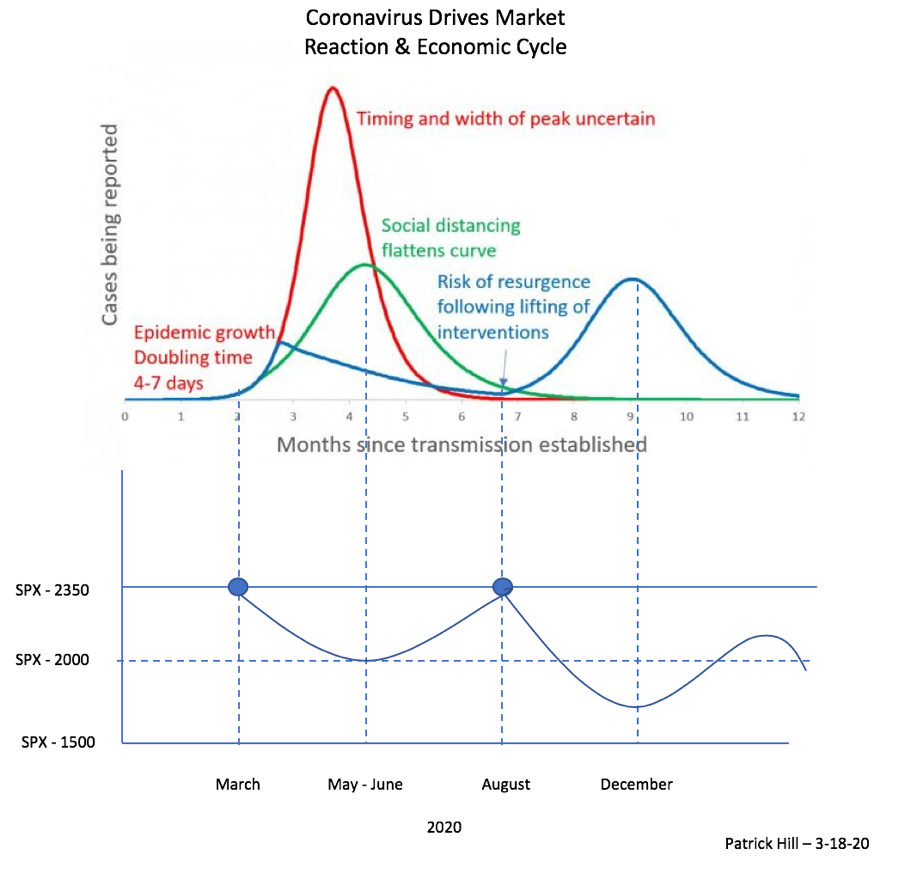
The chart below shows the inverse correlation between the expected peaks of the virus and potential lows in the markets:
Source: FIPhysician – & Patrick Hill – 3/18/20
In the COVID-19 – SPX model above, the steep red line is a forecast of new cases if social distancing were not in place. The green line shows how social distancing will flatten the curve of new cases. The blue curve shows how growth in the pandemic may unfold doubling every 4 – 7 days. The lower chart shows how social distancing correlates to movements in the SPX. As the number of cases peak, there is a related trough in the SPX. Looking at present levels, we are likely to see more selling as the number of cases increases to a possible low of 2000 in the May-June time frame.
Epidemiologists currently forecast the COVID -19 pandemic will unfold in two waves, with the current breakout and remission during the summer followed by a possible second breakout in the fall and winter of this year. Researchers think the closest analog to the COVID -19 pandemic is the Spanish Flu in 1918, which came roaring back the following winter resulting in a second wave of even greater infections and death.
The first blue dot shows where the SPX is today at this early stage in the pandemic. The SPX index may continue to fall as the economic damage increases and GDP declines in the first and second quarters. Two consecutive declines will officially put the economy in a recession.
The SPX may fall to 2030 in this first wave, which represents a Fibonacci retracement of 50 % from the 2008 low to the 2020 peak.
From there, markets may rebound back up to 2350, a Fibonacci retracement of 61% as the virus breakout fades, relief rally emerges, and economic activity picks up. However, as this occurs, higher interest rates from massive stimulus spending may weigh on financial markets, as seen in the spike of bond yields, the decline in gold prices and other safe haven assets.
Consumers who are already financially stretched are being furloughed or laid off, which will trigger loan defaults. Finally, corporations are now at the highest level of debt since 2008 and are experiencing a steep decline in sales, causing a cash squeeze leading to layoffs. The most important consideration is that the virus is exposing the heavy reliance on debt on major institutions and consumers in our economic system.
The slide into a recession is evident in announced layoffs by significant corporations. Marriott and other hotels have announced thousands of layoffs. Other hospitality industry companies will follow. Harley-Davidson, GM, Ford, Fiat Chrysler, Nissan, and Tesla have all suspended manufacturing for several weeks in the U.S. Thousands of workers are on furlough until manufacturing resumes. There is a growing risk consumer demand may not return to pre coronavirus levels forcing permanent layoffs.
While manufacturing is 30% of GDP, services contribute 70% of GDP. Many services can be offered online or via web conferencing. The present social distancing experiment will provide significant insights into how well the economy can perform when many knowledge workers are working from home. If working from home is successful, we expect to see more companies permanently move employees to their homes to reduce office space and cut expenses. This has grave implications for the commercial real estate industry and investors of those properties.
The diverse U.S. economy is likely to recover quicker than the world economy. However, an earnings recovery may stall due to the fact most S&P 100 companies derive 55% of their sales from overseas and 60% of their profits from international markets.
Looking at a possible second virus wave in the fall, it is likely that economic damage will grow worse due to increasing unemployment, declining corporate spending, falling consumer spending, and a resumption of social distancing. The second wave fits a decline model seen in 2000 from the Y2K software bug scare. That crisis was an external event, causing a demand shock, though little supply shock. The bottom for the NDX did not happen until 18 months after the market peak. The virus seems to be compressing the market drop period as there have been three trading halts of 7% in the markets in just eight days of trading. SPX support is near 1810 – 1867 in 2016, just above the Fibonacci 38% level of 1708.
In our post of February 14th about the coronavirus triggering a downturn, we saw the strong possibility of the economy sliding into a recession. In the post we noted that Allianz Chief Economic Advisor, Mohammed El-Arian observed that we are likely headed into a U or L shaped recession:
“…analysts and modelers should respect the degree of uncertainty in play, including the inconvenient realization that the possibility of a U or, worse, an L for 2020 is still too high for comfort.”
Hope is not a strategy. Of course, we hope the virus is contained, lives saved, and the economy can weather the stress on corporations and consumers. However, as long term investors, we need to look at the reality of what may happen based on research and plan our strategic investments accordingly. Plan for the worst, and hope for the best.
Tyler Durden
Wed, 03/25/2020 – 11:30
