The Last Time This Happened To Oil, Stocks Collapsed 30%
While the velocity of stock markets’ rebound is making headlines, it’s the energy complex that is screaming at the top of its lungs – something is wrong, very wrong.
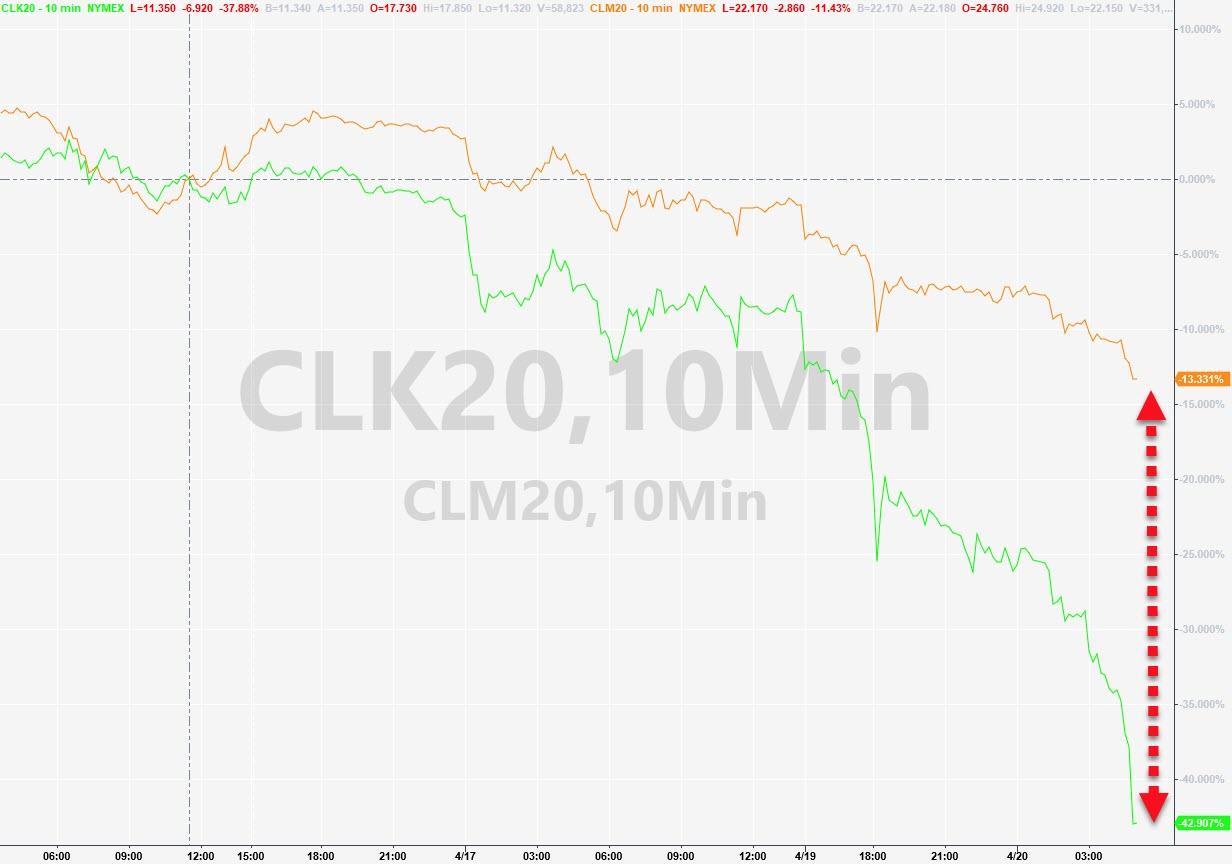
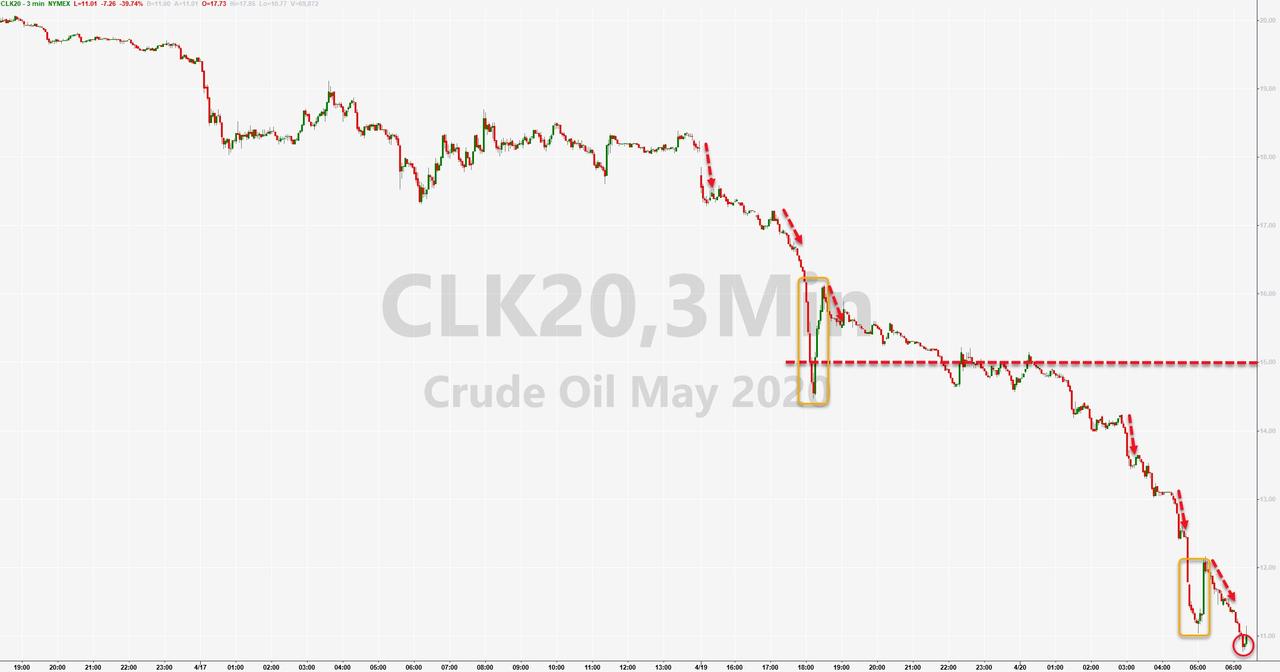
A total bloodbath in black gold this morning as a combination of fundamental (weaker and weaker demand outlooks as global GDP forecasts collapse and headlines that Russia actually increased supply by 1% in the last 3 days) and technical (massive flows into USO – the Oil ETF – and shifts in the way the ETF is constructed to use 2nd month futures, combined with the contract roll) has sent the front-month (May) WTI futures down a stunning 40%-plus….
With the May contract trading with an $10 handle…
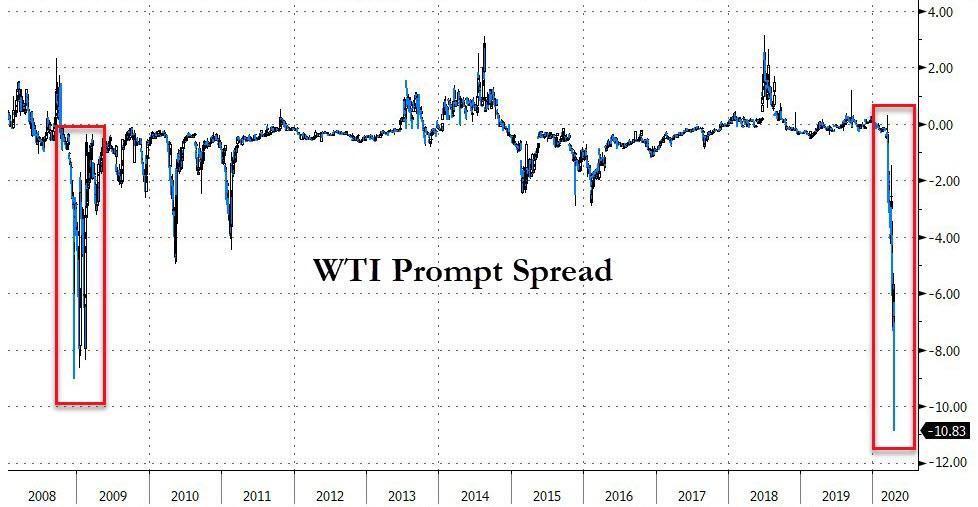
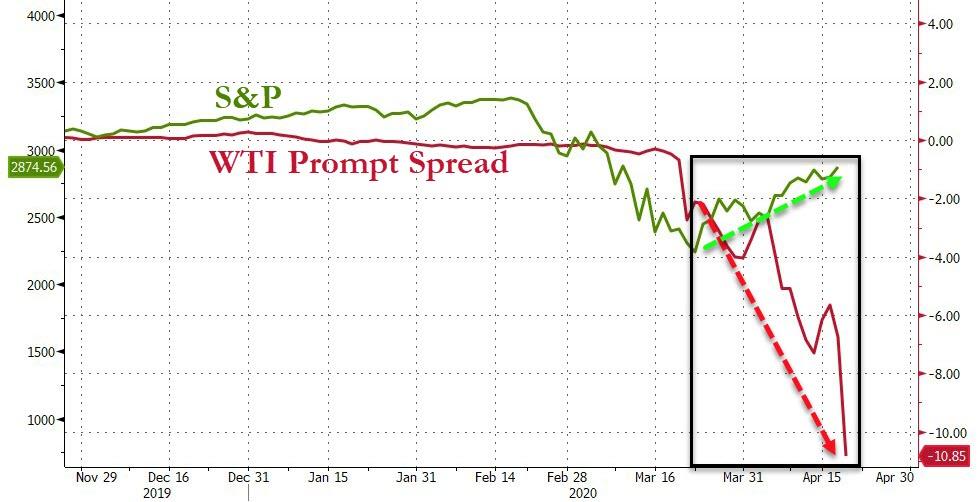
Most critically, the prompt-spread (between May and June in this case) has collapsed to record lows…
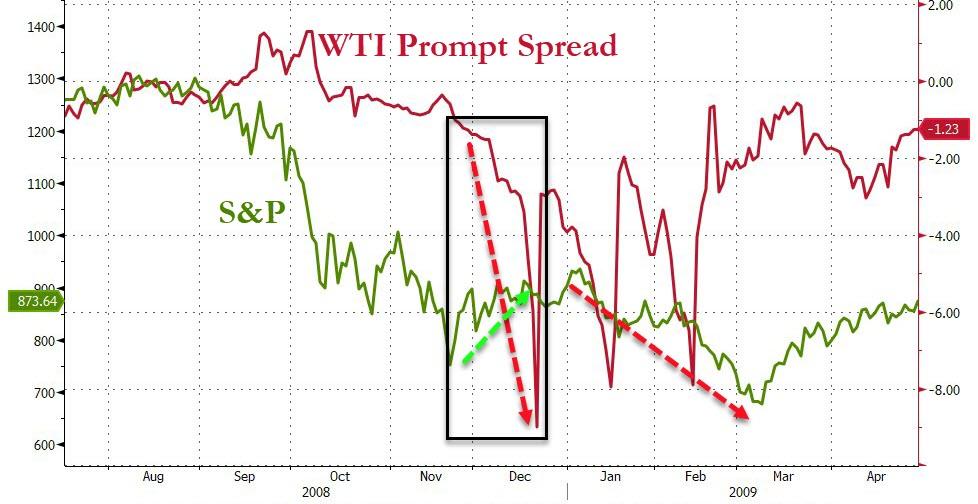
We have seen this pattern before – as the chart above suggests. Bloomberg’s Cameron Crise also notes that the last time we saw such a huge spike the prompt-spread was December 2008… which just happens to coincide with an equally impressive surge/rebound in US equity markets (27.5% on a trough to peak basis from mid-November to early January)… only to end very badly around 30% lower…
Coincidence that we are seeing the exact same pattern play out as stocks soar and oil’s curve implodes?
As Crise warns, maybe the oil market is offering a warning of just how significant the economic damage will be – damage that you could argue is no longer reflected in the price of equities (which seem entirely focused on The Fed put and vaccine/treatment hopes).
Trade accordingly.
Tyler Durden
Mon, 04/20/2020 – 10:55
