“Stocks Have Never Been More Expensive”: Disconnect Between Markets And Reality Hits Idiotic Levels
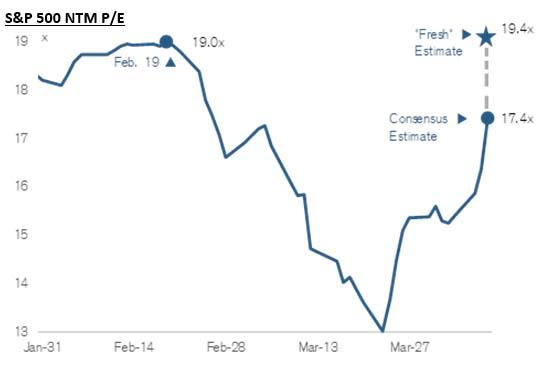
One month ago, with the S&P500 staging an impressive V-shaped rebound from the March 23 lows after the Fed unleashed a nuclear bomb of monetary stimulus, we showed that forward stock multiples had surged right back 19.4x, which was just above the level the S&P500 held on Feb 19 when it was trading at an all-time high above 3,330. In other words, at in the first week of April, stocks were valued the same as they were at the February all time highs, which we showed in the following chart.
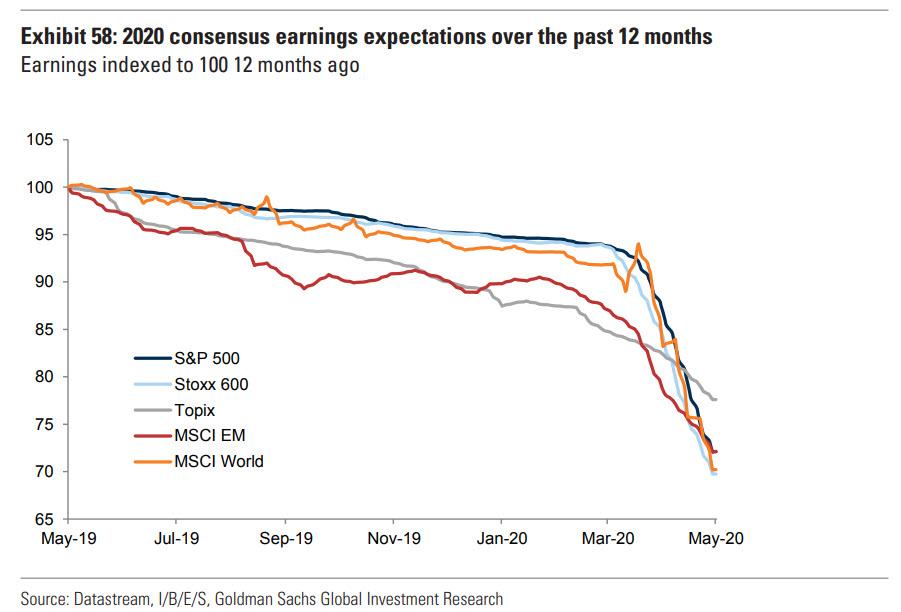
Fast forward one month when two things have happened: stocks have risen further, with the S&P rising just shy of 3,000 last week, while earnings expectations across the entire world have continued to slide and are yet to stabilize let alone find an inflection point, as the following Goldman chart shows:
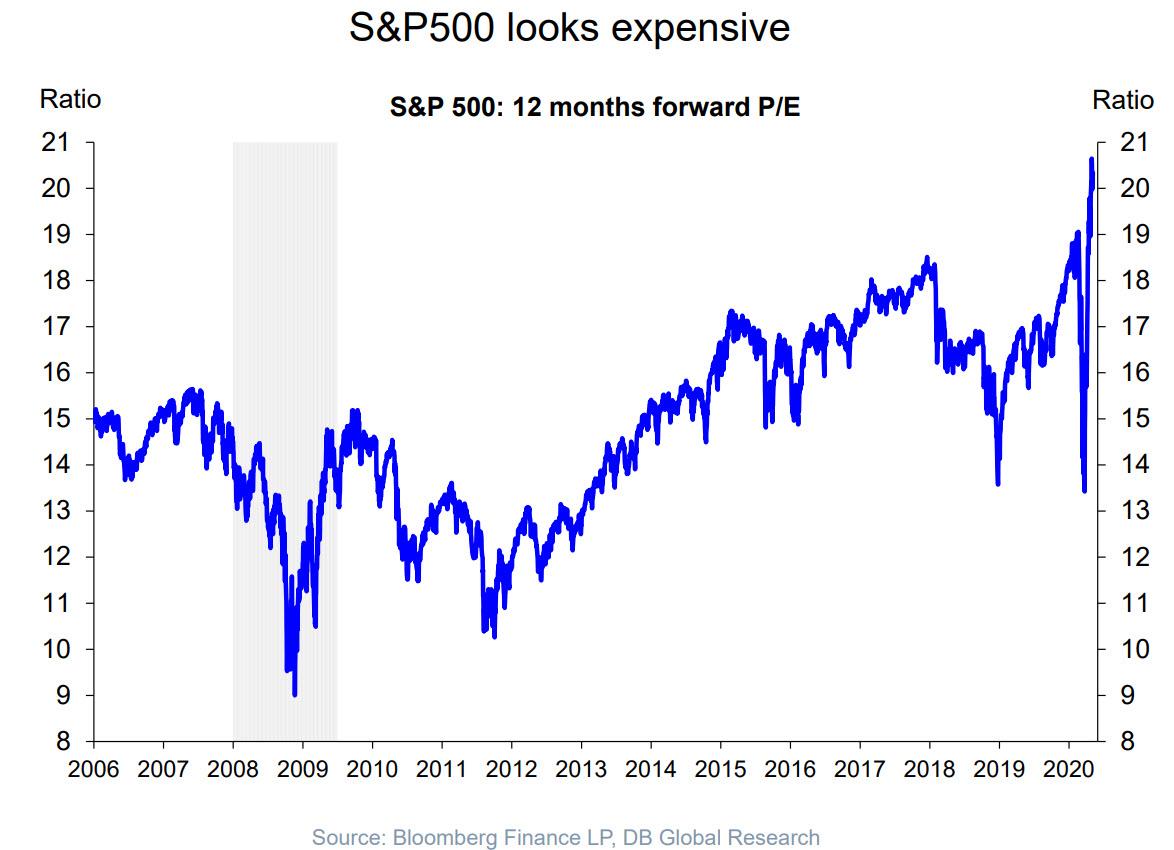
This means that the chart we showed above which hit a 19.4x forward P/E is now even more idiotic, and below is an update of our chart courtesy of Deutsche Bank’s Torsten Slok.
This is what Torsten said:
It is difficult to think about the E in the P/E ratio when the economy is shut down and half of blue-chip companies don’t want to provide guidance on full-year earnings because of all the uncertainty. The Fed probably doesn’t worry much about if the forward multiple is 18, 20, or 25, their clear goal is to support markets at least as long as we are in lockdown and maybe until the unemployment rate has moved into the single digits again.
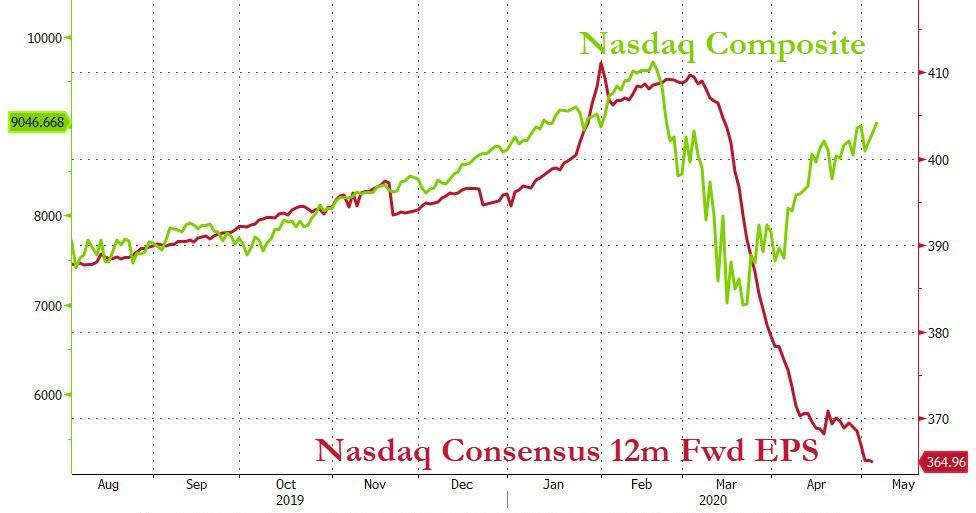
And just to show the idiotic disconnect between V-shaped markets and \-shaped reality, here is all you need to know about the Nasdaq:
And just to confirm that the “disconnect between markets and data is the largest on record”, here is the only chart you need from Matt King’s latest presentation.
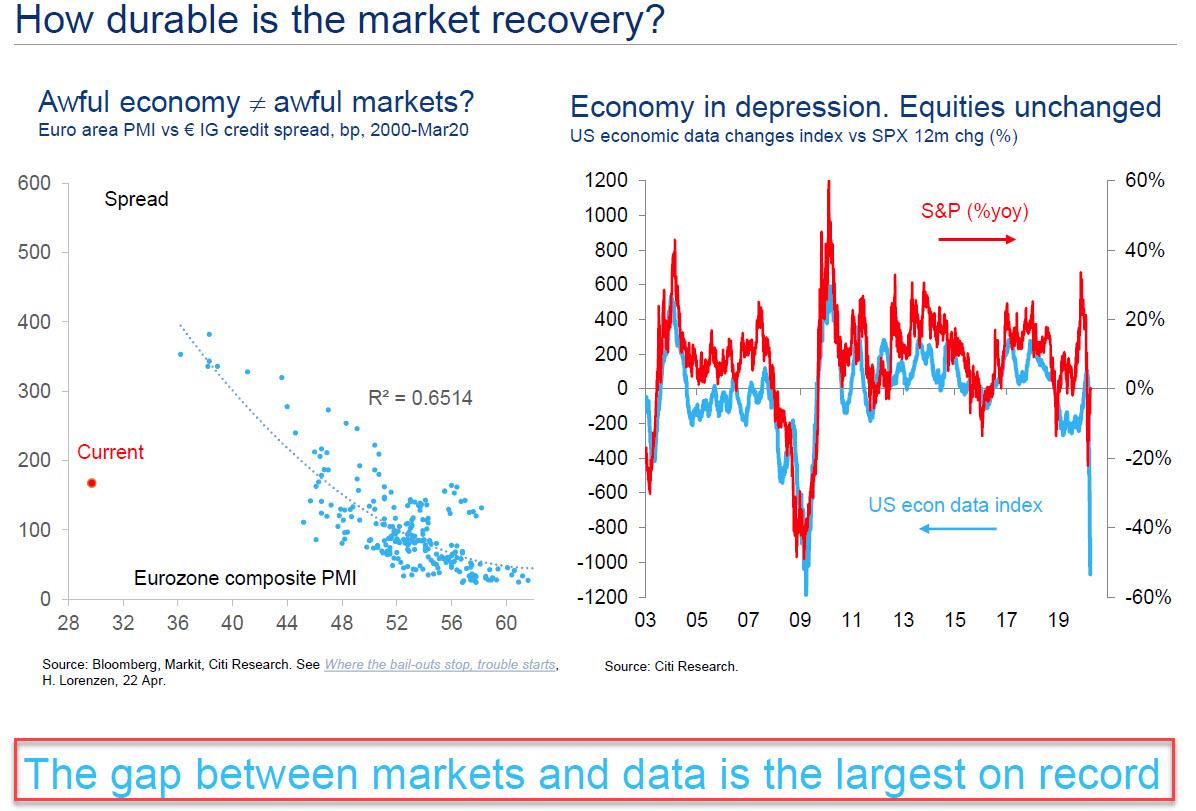
And as King concludes, “when limitless liquidity meets spiraling insolvency there’s bound to be a long-term price.“
Tyler Durden
Wed, 05/06/2020 – 14:50
