Fed’s Q2 GDP Estimate At -34.90%… So What Now?
Summary
-
The Atlanta Fed’s GDP Now is estimating a -34.9 percent Q2 GDP print, which is 3.5x the largest quarterly decline in the post-WWII economy
-
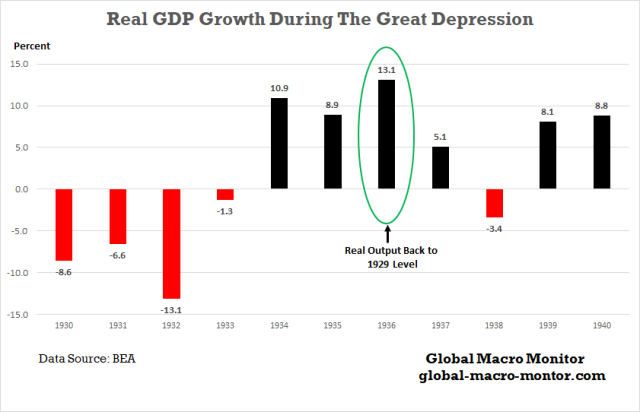
If realized, the 11.3 percent non annualized first-half GDP collapse in 2020 will approach the worse year of the Great Depression, when in 1932, the economy shrank 13.1 percent for the entire year
-
We are not paying much attention to these numbers as they reflect an economy that has been closed for two months, which should experience a relatively sharp snapback in Q3, with unemployment most likely peaking this month
-
Nonetheless, the pandemic and economic lockdown will do long-term structural damage to the economy
-
The rapid growth of the monetary aggregates alleviates much of the deflationary forces in the economy in the short-term and we perceive inflation a much bigger risk over the medium-term
-
If the GDP Now estimate holds, and even if GDP prints a record annualized 27.6 percent number in Q3, real output will still be 7 percent below the Q4 2019 level with unemployment remaining close to low double digits
-
We suspect the will recovery will come too late and not be enough to save President Trump and the Republicans though the White House will tout it as the greatest economic recovery in the history of the world
-
Investors and companies should plan for higher capital gains and corporate taxes
-
Check out the astonishing performance of our stock picker’s large-cap portfolio, which is trouncing the S&P500 this year
Since the COVID crisis hit America, many businesses are operating at limited capacity while others have ceased operations completely. The unprecedented aggregate supply and demand shock to the U.S. economy has resulted in horrific economic data, including the 20.5 in nonfarm payroll jobs for in April and the unemployment rates shooting up over 14 percent.
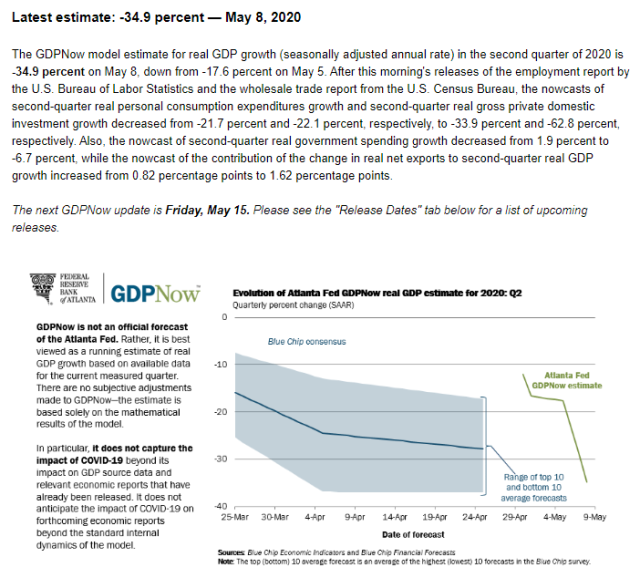
The data released Friday also caused the Atlanta Fed’s GDP Now model to lower its Q2 GDP estimate to a stunning annualized -34.9 percent, which puts it at the lower end of the range of Blue Chip forecasts. The GDP Now Q2 estimate will certainly change as new economic data is released over the next few months.
Context
It is important to keep the data in context. The economy has been slammed shut for two months and is just starting to slowly reopen. The data surely does not reflect the prospects for the economy over the next 12 months unless a second and more virulent wave of COVID-19 breaks out, which is not a zero probability, by the way.
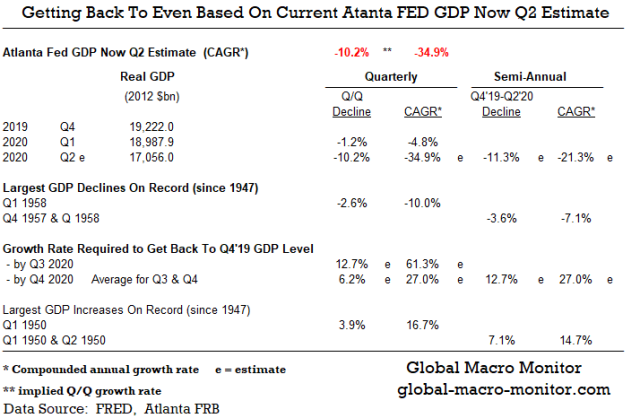
Still, if the GDP Now Q2 estimate does come in at the annualized -34.9 percent, it would represent a quarterly collapse 3.5x the next largest decline of 10.0 percent during the Eisenhower recession in Q1 1958. Even more stunning, the non annualized first-half 11.3 percent GDP collapse in 2020 would approach the worst year the Great Depression when GDP fell 13.1 percent for the entire year during a period of mass bank failures.
Depression Data But Depression Not The Base Case
We all can take a little consolation and hope, at least for now, that though we are witnessing economic data plumbing the depths of the Great Depression, the data will improve as the economy slowly reopens. It is uncertain how much structural damage the pandemic and the temporary lockdown has done to the economy but it will be significant.
There is no doubt it will take some time for the economy to recover. How long is anyone’s guess?
The table above illustrates for GDP to recover its Q4’19 level by Q3 (assuming the Q2 GDP Now estimate holds), growth would have to snap back by an annualized 61.3 percent next quarter. To recover real output fully by the end of the year, GDP growth would have to average an annualized 27 percent in Q3 and Q4.
We. Don’t. Think. So.
Recovery During The Great Depression
During the Great Depression, the economy didn’t recover its 1929 real output level until 1936.
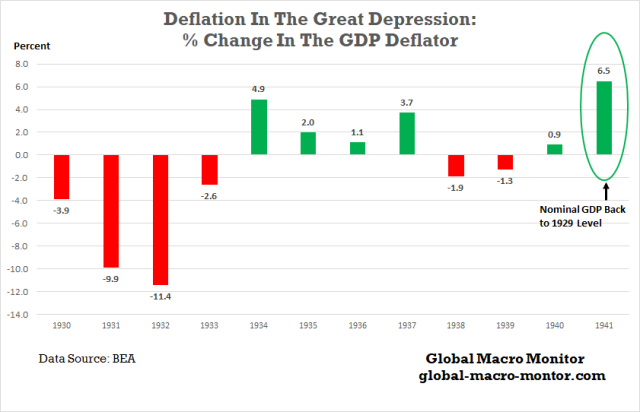
Furthermore, because of the virulent deflationary forces that took hold during the Depression, the result of the 25-30 percent contraction in the monetary aggregates, caused by the massive bank failures from 1931-33, nominal GDP did not recover its 1929 level until 1941. From 1929 to 1933, demand deposits, which made up over 85 percent of narrow money in 1929, fell by 35 percent.
That’s not a problem today as illustrated in the following charts of the compounded rate of change in M1 and M2. While many fret over the temporary deflationary pressures, some of which are just relative price changes as the economy begins to adjust to the post-COVID new normal, we fear more about a coming wave of inflation over the medium-term, which absolutely nobody is prepared.
Lord have mercy on bond investors.
M1 Money Stock Compounded Rate Of Change
M2 Money Stock Compounded Rate Of Change
Go Stonks
A macro argument has and can be made when the monetary aggregates are growing faster than nominal GDP it provides the liquidity and rocket fuel for the stock market. Just throwin’ it out there.
Q3 Economic Snapper Is Coming
We suspect the economy has already troughed and the employment data will bottom in May allowing GDP to realize a fairly sharp snapback in Q3, which will most likely exceed the 3.9 percent largest Q/Q GDP increase in the post-WWII period, which was registered in Q1 1950. There is no doubt the Trump administration will sell it as “the greatest economic recovery in history” and tout a huge annualized GDP growth number.
White House Cheerleaders Preparing The Pom-Poms
If the economy can muster, say, a 5.0 percent Q/Q growth rate in the third quarter, which is a push but not unreasonable that translates into a 27.6 percent growth headline number, far exceeding Q1 1950 16.7 percent annualized growth rate. Don’t you think the White House is preparing the pom-poms for such a rebound and cranking up the Tweet machine? We suspect this will be the central focus of the President’s campaign strategy.
Even so, U.S. real output will still be down 6.8 percent from its 2019 closing high and unemployment will most likely be in low double digits. Can Trump be re-elected with those numbers?
November Election
The body politic may give another POTUS, who is more empathetic, honest, more decisive, and popular the benefit of the doubt but that is not who Donald Trump is.
Based on our analysis, not our political bias, our central case, assuming a fair election, is the Democrats are going to take the White House, Senate, and House by wider than expected margins in November.
Recall our post in early April, Prepare For The Senate To Flip, when we were a lone voice crying in the wilderness. We were also putting our money where our analysis is,
We look at the individual Senate races and can’t understand why PredictIt is still pricing the Republicans to remain in control of the Senate with a 61 percent probability.
…We have our money where our analysis is, betting on a Blue Senate, and if we are right, we are looking at a 439.11 percent compounded annual return (CAAG) by election day. Beat that in the stonk market, folks.
The market is now about even money and climbing north the Dems will take the Senate. We are up 28 percent in 28 days, and everyone and their mother on Mothers Day is talking about how the Upper Chamber is now in play. We do realize 175 days to election day is an eternity in politics and much can change but we sense a wave election is building.
Investors and businesses should plan accordingly, including for higher corporate and capital gains taxes, which are the low hanging fruit. The markets are still obsessing over “flattening the curve” and the first-order existential effects of the pandemic.
Upshot
There you have it, folks. Our thoughts and best guesses. We are all in the guessing game these days and remain at the mercy of whatever trajectory the pandemic decides to take, which will largely be determined by the efficacy of U.S. health policy, or lack thereof.
As always we reserve the right to be wrong.
Tyler Durden
Mon, 05/11/2020 – 10:05


