18 Million Jobs At Risk Of Permanent Loss: What Happens To Small Businesses When The Bailout Money Is Spent
Tyler Durden
Sun, 05/24/2020 – 13:45
Submitted by Nick Colas of DataTrek Research
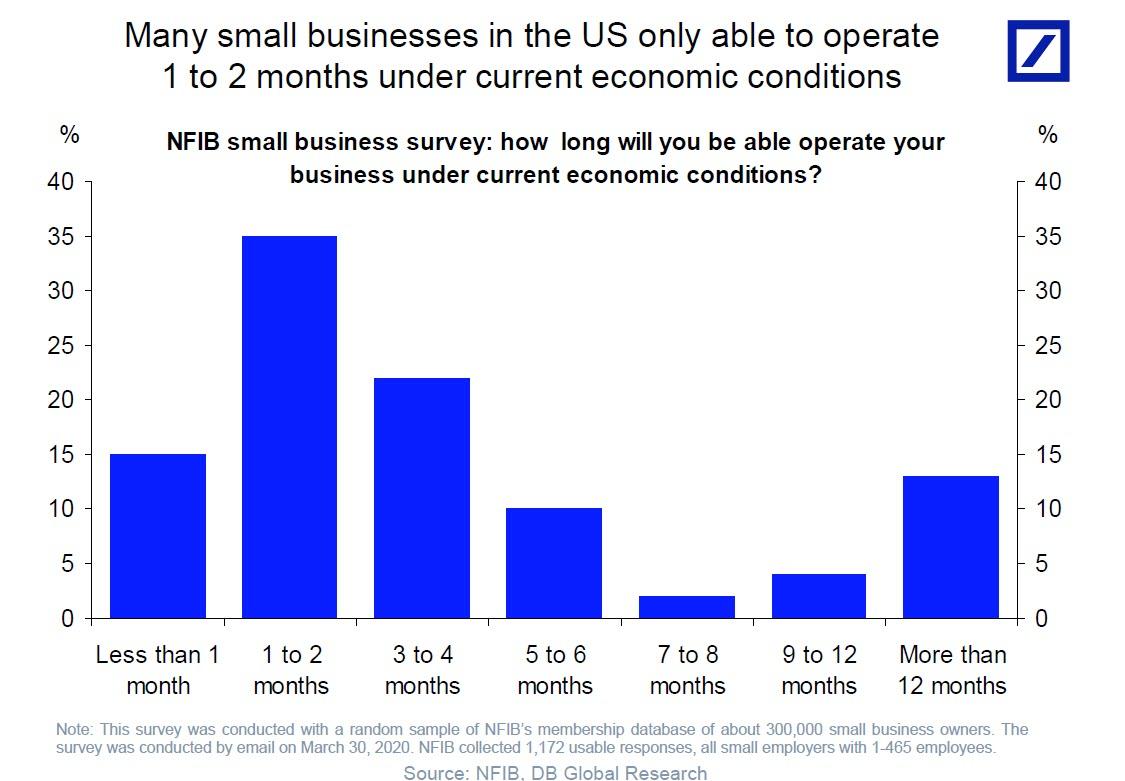
American small businesses are going to bear the brunt of the COVID Crisis and they employ 47% of the entire US workforce. Some will bounce back quickly (e.g. health care, construction, professional services) but accommodation/food service and retail will not. There are 18 million workers attached to small businesses there. Bottom line: at this early point in the cycle, large businesses have to find their footing because that’s what will set the floor on small business activity. The sooner that happens, the sooner small business America can start to recover.
We continue to worry – a lot – about how US small business will recover from the COVID Crisis, primarily because of this segment’s impact on the American labor market. According to the latest US Small Business Administration data (2016 calendar year):
- There are 30.7 million registered small businesses in the US, but the vast majority (24.8 million) have no employees. The important group for our purposes today is the 5.9 million small businesses that employ anywhere from 1 to 499 workers.
- Those 5.9 million firms have an aggregate payroll of 59.9 million people, 47.3% of the American labor force.
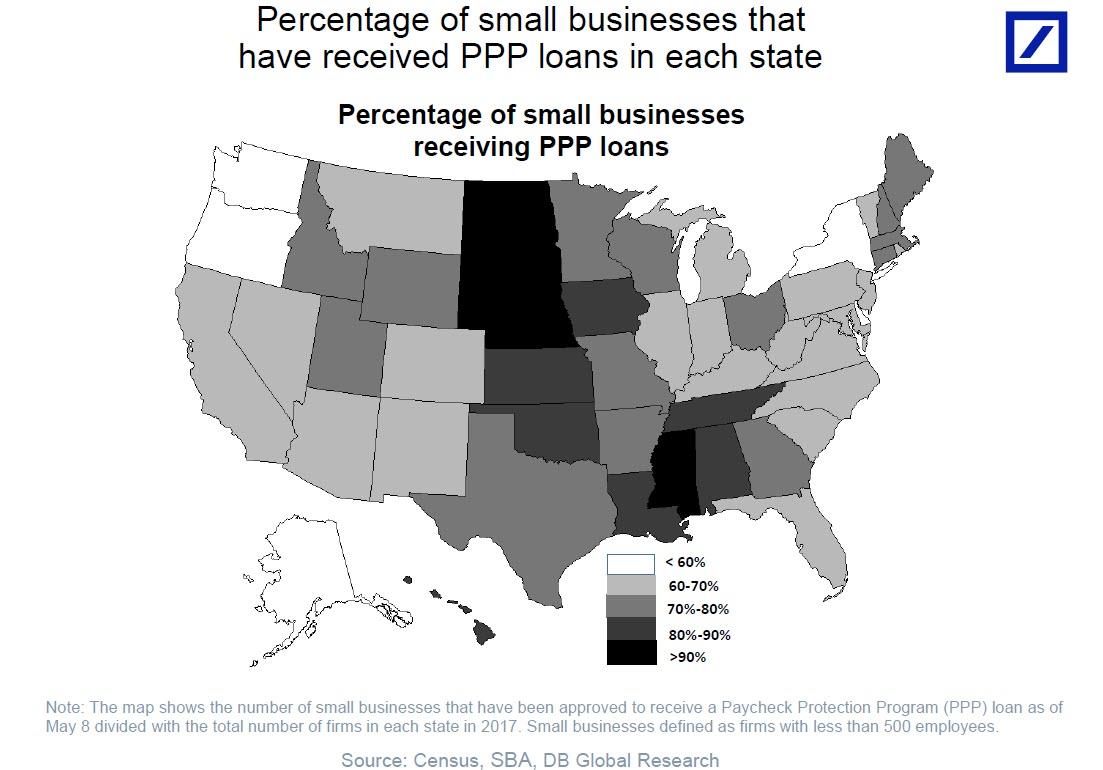
- Through May 16th (latest Treasury Dept data available), the Payroll Protection Program has made 4.3 million loans. This represents only 14% of total US small businesses.
On the one hand, it’s pretty impressive that the PPP has now gotten money to 73% of American small businesses that actually have a payroll; on the other, the program is only meant to be a short-term bridge loan/grant.
The question now is what happens to American small business once the PPP money is spent, and that requires a deeper dive into the data.
#1: Almost two thirds (64%) of US small business employment is concentrated in just 6 types of companies and their contribution to total US employment varies widely:
- Health Care and Social Assistance: 8.8 million workers (45% of total US employment in this category)
- Accommodation and Food Service: 8.3 million (61%)
- Retail Trade: 5.6 million (35%)
- Construction: 5.2 million (82%)
- Professional, Scientific and Technical Services: 5.2 million (59%)
- Manufacturing: 5.1 million (44%)
Takeaway: in terms of overall US labor market trends, small business employment in these 6 sectors is responsible for 30% of American jobs, so these are the industries to watch in the coming months as the country reopens.
#2: Small business employment in industries which 1) rely largely on face-to-face customer interaction but 2) are not heath care/assistance related and therefore must spend more time and money adopting new business practices and/or adapting to capacity limits:
- Accommodation and food service: 8.3 million workers
- Retail trade: 5.6 million
- Educational services: 1.6 million
- Real Estate and Rental and Leasing: 1.4 million
- Art, Entertainment and Recreation: 1.4 million
- Total: 18.3 million
Takeaway: we would argue that this 18 million worker cohort is at the most risk of permanent layoffs over the next 6 months. Some industries – education and real estate, for example – can more easily adapt to either remote operation or address health concerns with appropriate modifications. But it’s harder to see how small businesses in accommodation/food service, retail, and arts/entertainment will bounce back quickly; that’s 15 million workers. Assume 25% of those businesses fail and others have to cut back, and a 33% reduction in the workforce or 5 million jobs lost seems like a reasonable estimate.
#3: Small businesses employment percentages varies quite a bit by region across the US. Here are the 10 states that contribute most to US GDP (half the nation’s total) and their small business percentage of total employment:
- California (49%), New York (50%), New Jersey (50%) and Washington state (51%) are at the top of the range.
- Florida (42%) and Georgia (43%) are at the low end.
- Texas (45%), Illinois (45%), Pennsylvania (47%) and Ohio (46%) are close to the 47% national rate.
- As far as density of small business employment, it tends to be highest in rural areas. No surprise there, since there is often no large employer in the area. Here is the SBA map:
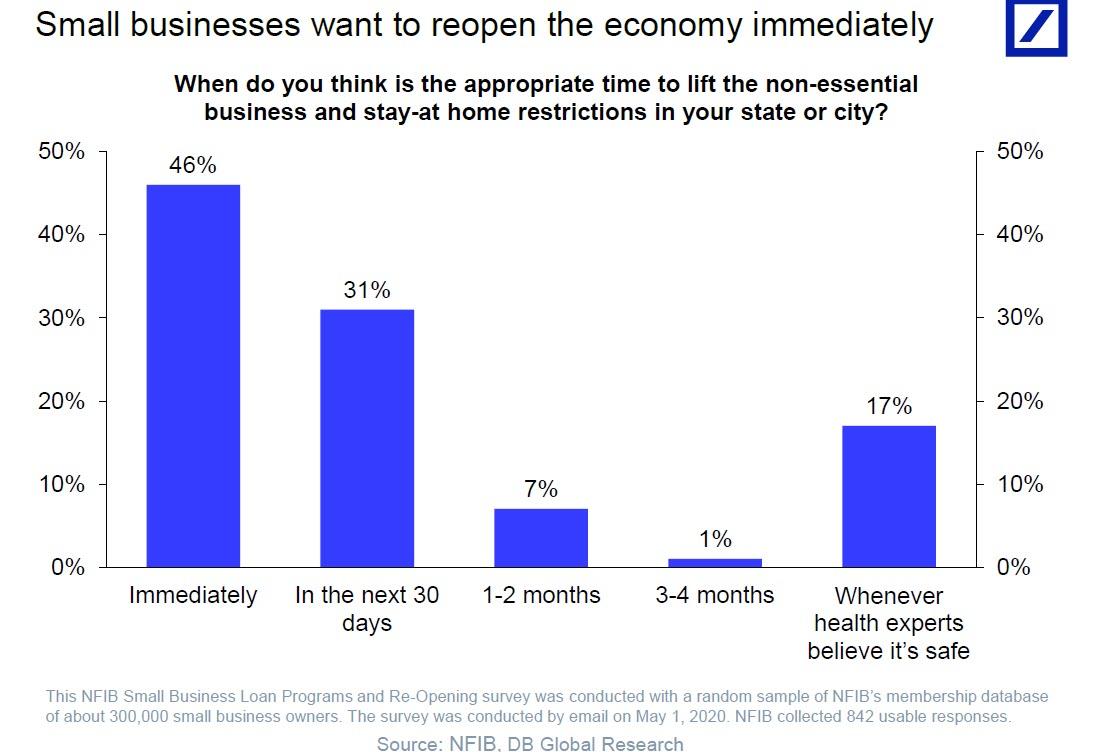
Takeaway: slower to open states (CA, NY, NJ) have higher percentages of small business employment than those that have gone more quickly (FL and GA). The sorts of small businesses that employ millions of workers in these states look very much like the national numbers: accommodation/food service and retail are at/near the top of the list. All this adds up to a greater chance of permanent job losses at the margin for the US as a whole.
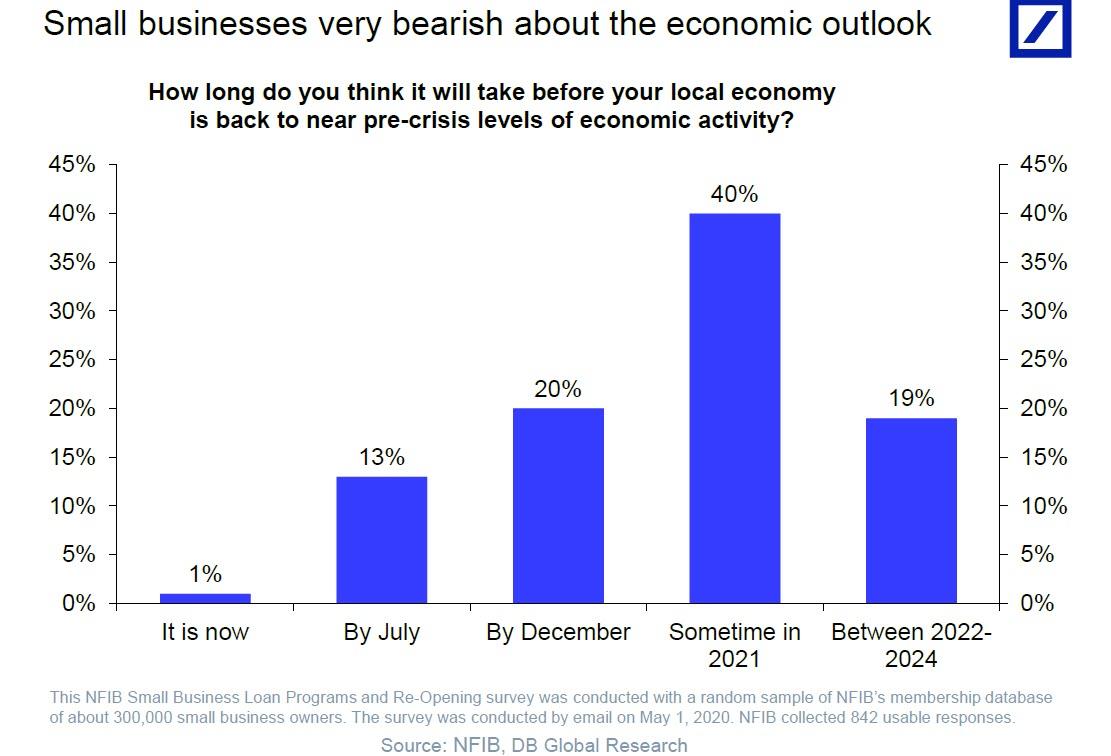
All this reads pretty bearish for the US labor market and economy generally, but we’ll close out with a more upbeat observation: large businesses drive the US economy off a cyclical bottom and as they regain their footing small businesses start to pick up as well. It is a myth that it works the other way around. We’ve seen this in many places over the decades, from restaurants in Midwest factory towns to dog walking businesses in Manhattan. Larger operations, by dint of scale and scope, do the first rehiring and spending once a recession ends. That incremental activity then flywheels into small business growth over time.
It will work the same way now – the only question is how quickly it happens.
Sources:
- 2019 SBA Small Business Profile Report, National and State level data: https://cdn.advocacy.sba.gov/wp-content/uploads/2019/04/23142610/2019-Small-Business-Profiles-States-Territories.pdf
- Latest Treasury PPP report (May 16th): https://home.treasury.gov/system/files/136/SBA-Paycheck-Protection-Program-Loan-Report-Round2.pdf
