Hedge Funds Have Never Been More Concentrated Into The Same Handful Of Stocks
Tyler Durden
Sun, 05/24/2020 – 17:45
Six years ago, back in 2013, we presented what we then viewed (and still view) as the best trading strategy of the New Abnormal period, when we said that buying the most shorted names while shorting the names that have the highest hedge fund concentration and institutional ownership is the surest way to generate alpha, to wit:
… in a world in which nothing has changed from a year ago, and where fundamentals still don’t matter, what is one to do to generate an outside market return? Simple: more of the same and punish those who still believe in an efficient, capital-allocating marketplace and keep bidding up the most shorted names.
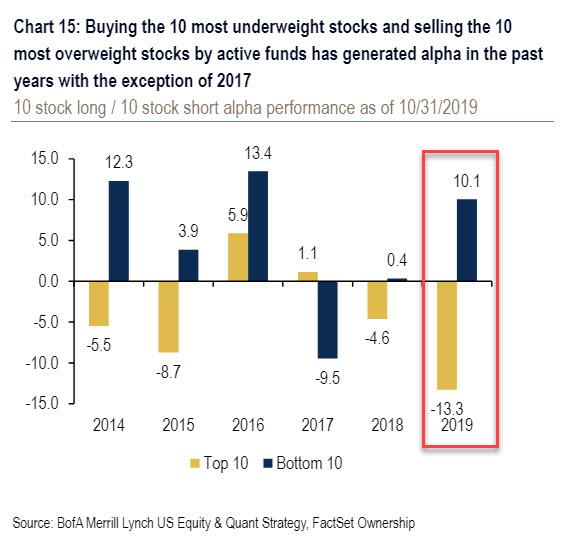
Following this initial observation, we would periodically urge readers to keep doing this simple trade year after year, which repeatedly proved to be the best source of alpha in a market that has become infatuated with beta, as none other than Bank of America confirmed in late 2019 when it showed that going long the most shorted names and shorting the most popular ones has continued to be not only the most consistently profitable, alpha-generating strategy, but that in 2019, the top 10 crowded stocks underperformed the 10 most neglected stocks by 23%, the most on record!
The topic of high investor concentration also dominated the latest hedge fund monitor report from Goldman Sachs which once every quarter summarizes the bank’s take on hedge fund positioning based on 13F reports.
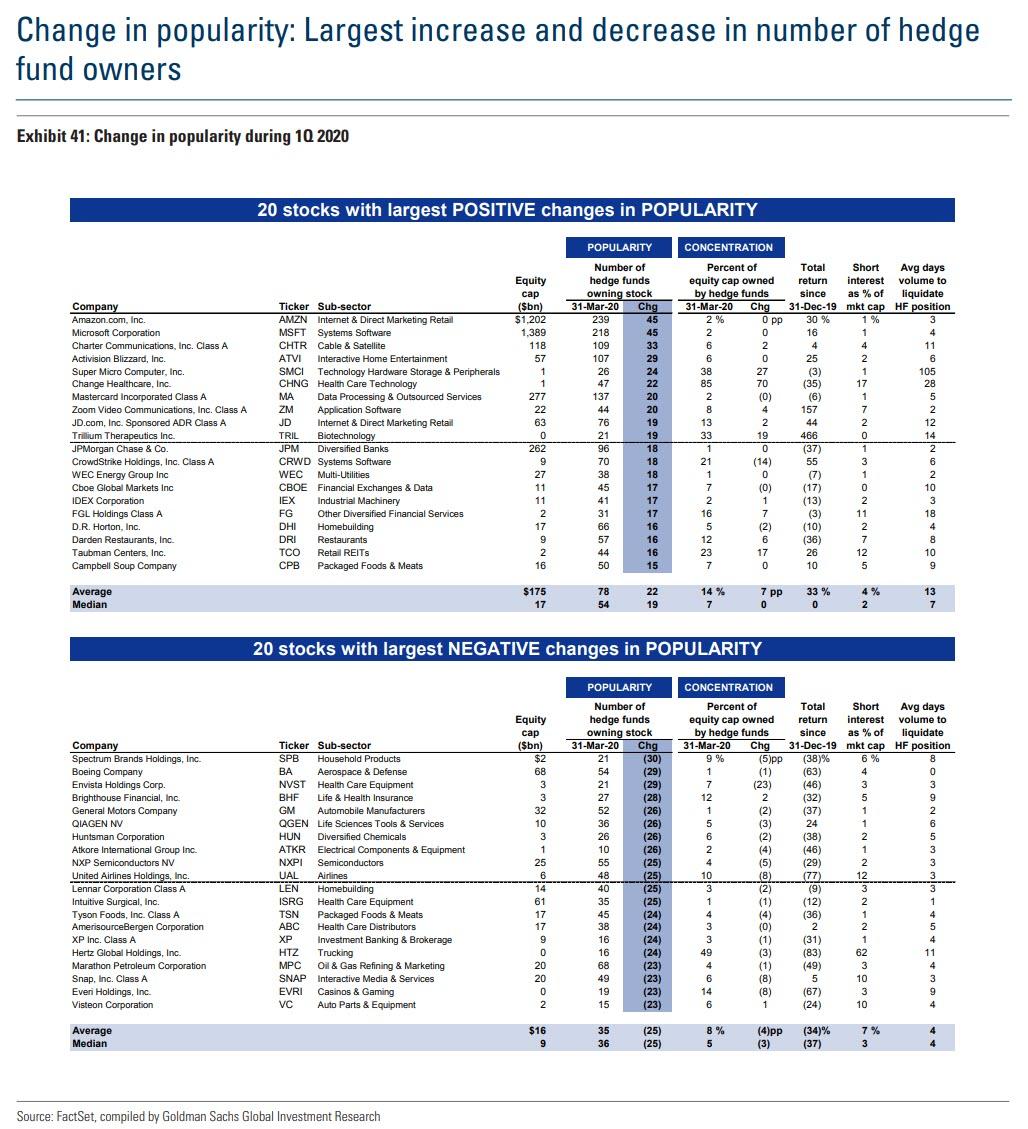
Not surprisingly, what it found is that as the coronavirus pandemic sparked a 34% plunge in US equities – before the Fed stepped in – hedge funds, scrambling to protect against further losses, concentrated their portfolios even further into their favorite growth stocks. This happened even as HF tilts to growth stocks and defensive industries were large coming into 2020, and at the start of 2Q rivaled the most extreme levels on record. In fact, according to Goldman, the two stocks with the largest increase in hedge fund popularity in 1Q – AMZN and MSFT – already ranked among the top stocks in our VIP list of the most popular hedge fund long positions. This represents the seventh consecutive quarter with the same top 5 VIPs. AMZN has topped the list in 5 of the last 6 quarters.
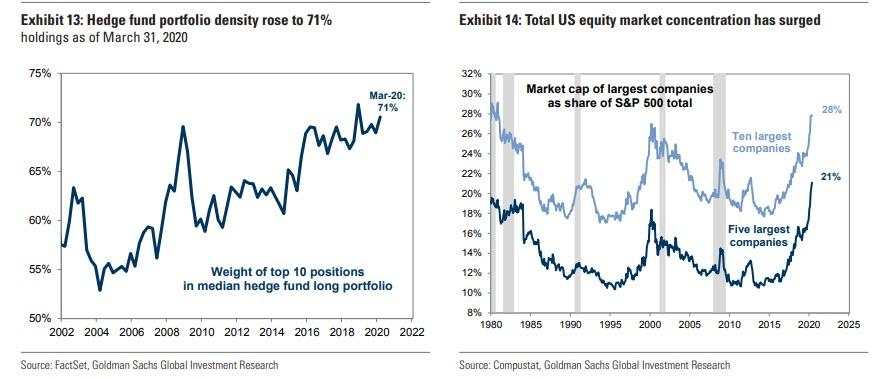
In other words, if something eventually does happen to the FAAMGs – and Goldman is on the record warning that sooner or later there will be a painful repricing of these stocks that now account for 21% of the S&P’s market cap – the entire hedge fund industry will blow up.
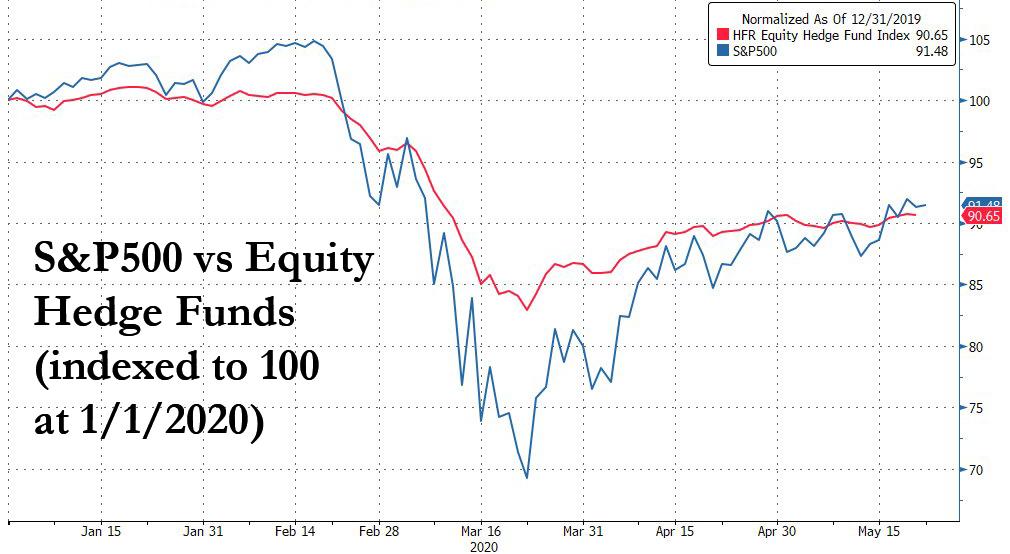
And speaking of hedge fund performance, it will come as a shock to nobody that according to the HFR equity hedge fund index, the S&P500 and the broadest tracker of equity hedge fund performance are virtually neck and neck YTD, with the one highlight that one doesn’t pay 2 and 20 to buy the SPY, which as we have repeatedly pointed out over the years, is now explicitly micromanaged by the Federal Reserve itself, once again begging the question: what’s the point of hedging when central banks will not allow any sustained drop?
Of course, loathe to give up on all those millions in management and underperformance fees, the hedging continues, and what happened in the first quarter is a narrative with two key parts: i) hedge funds got slammed by being overly concentrated in the same handful of stocks with adverse performance from all but the biggest megacaps detracting from overall HF P&L and ii) the outperformance of just the five biggest stocks, the FAAMGs (a topic extensively covered here) offsetting the underperformance of everything else.
Of, as Goldman summarizes this, “market beta has weighed on the average hedge fund return this year, while alpha has been a strong positive.”
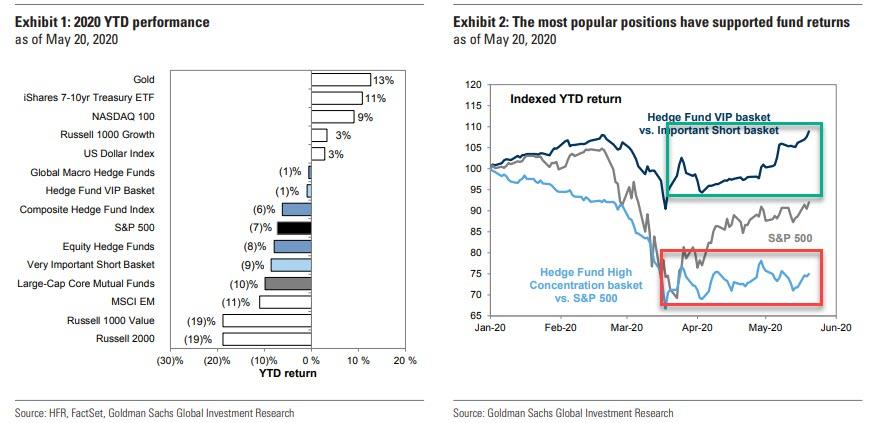
This divergence of performance can be observed in Goldman’s Hedge Fund VIP basket, which tracks the most popular hedge fund long positions, which outperformed the S&P 500 by more than 600 bp and a basket of the largest short positions (GSTHVISP) by more than 750 bp YTD.
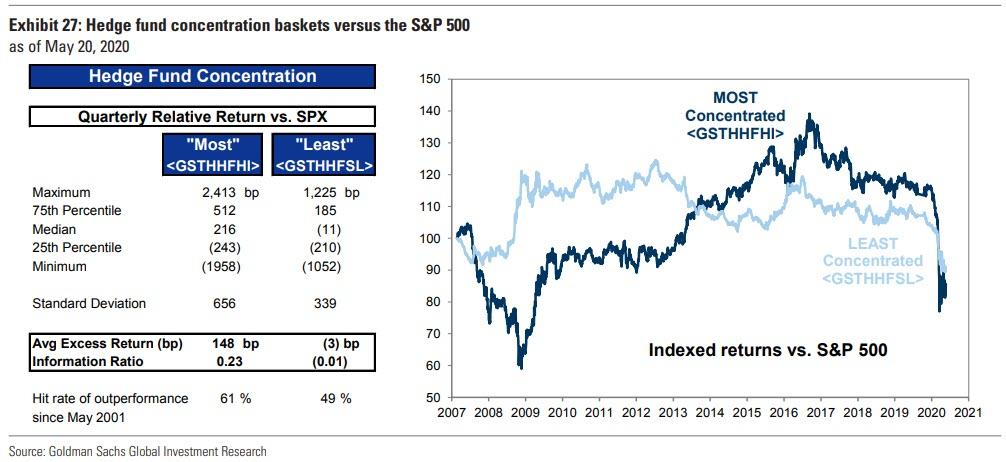
At the same time, while the most popular long positions have generally outperformed, Goldman’s High Concentration basket (GSTHHFHI), which contains the stocks with the largest share of market cap owned by hedge funds, has lagged the market by 24% YTD! This is shown in the chart below, which basically confirms why hedge funds have once again failed to outperform the S&P: the reason is that even as the FAAMGs soared in Q1, the rest of hedge fund portfolios failed to perform, and the result was a net wash vis-a-vis the S&P500 (and yes, as the observant ones will point out, one could have just bought gold and spared a bundle on management fees while avoiding market volatility and be up 13% for the year).
Drilling further down on the topic of hedge fund concentration and crowding, both of which are at or near all time highs, Goldman notes that “hedge fund portfolio concentration rose further in 1Q, mirroring the sharp rise in total equity market concentration.” As a result, the typical hedge fund holds 71% of its long portfolio in its top 10 positions, up from 60% five years ago and just off the record high of 72% at the start of 2019. At the risk of repeating ourselves again, because we have said this on many times before, perhaps it is time to remove the name hedge fund and just call them “concentrated investment” funds.
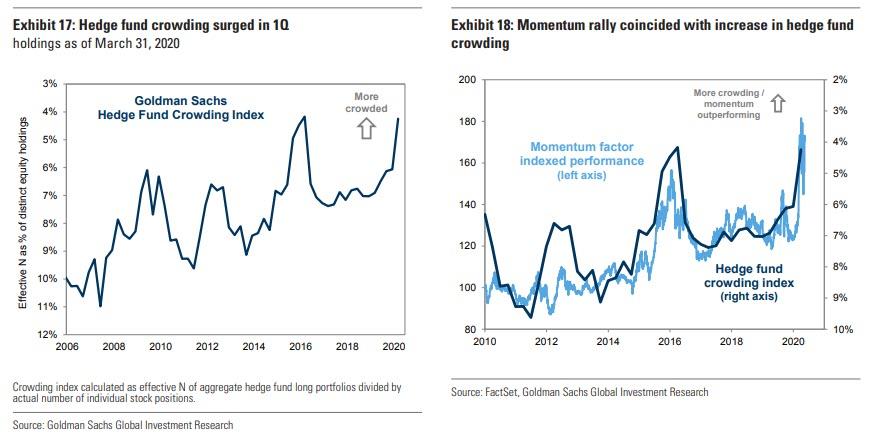
In addition to rising concentration within the average hedge fund portfolio, crowding in common positions across hedge fund portfolios also surged, matching the highest level on record as halpless hedge funds conferred with each other in mid/late March what they should be buying, and they all appear to have decided on the same handful of stocks. No surprise then that Goldman’s hedge fund crowding index now matches its previous high in early 2016: “as investors grappled with the largest economic collapse on record, they shifted further into already-popular large-cap secular growth stocks, boosting momentum strategies. Our long/short Momentum factor has returned 30% YTD, consistent with previous episodes of economic downturn and increased hedge fund crowding.”
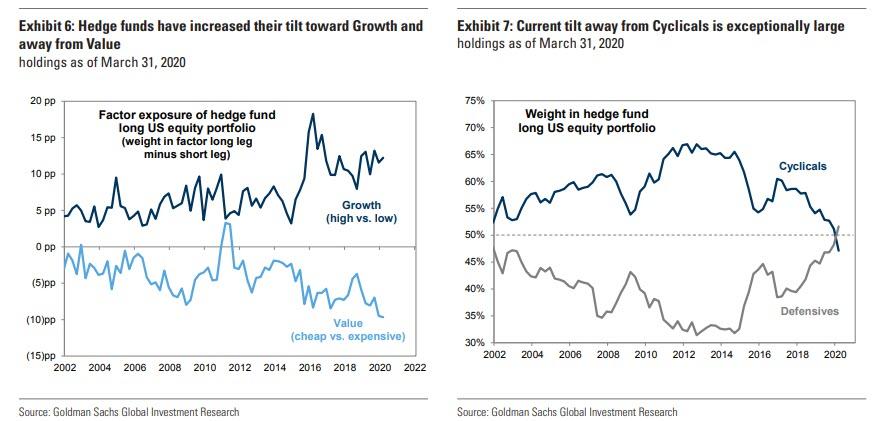
Part and parcel with the record concentration in momentum stocks, and the flood into the FAAMGs, as the market plunged in 1Q 2020, hedge funds rotated even further toward Growth and away from Value, as the record underperformance of value vs growth demonstrates (crushing thousands of so-called “value investors” like Warren Buffett in the process).
As Goldman notes, the outperformance of secular growth stocks during the market decline both rewarded and helped extend a rotation of fund portfolios that has been ongoing for more than two years. Although aggregate hedge fund long portfolio exposure to Growth remains shy of its 2016 peak, the most recent filings show an unprecedented tilt away from Value, which is also attributable to central banks having crushed any rationality and logic in what Bank of America last week called a “fake market.” Similarly, the multi-year rotation of portfolios from Cyclical industries toward Defensive industries extended during the sell-off, with Defensives now accounting for more than 50% of long assets for the first time in Goldman’s 18-year data history
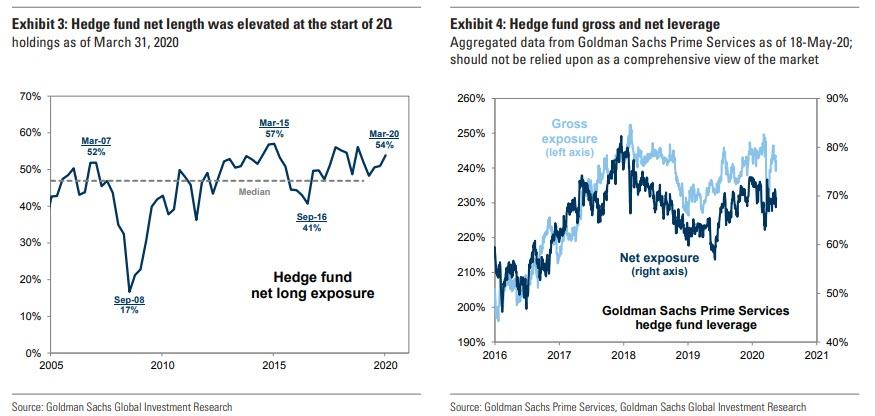
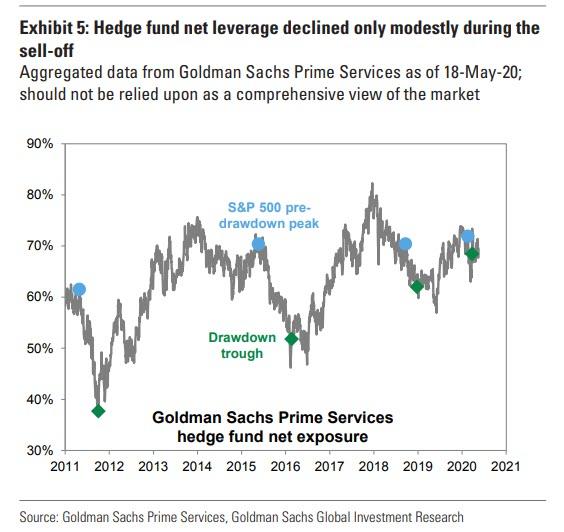
And while we know what hedge funds did, what about how they did it, in other words did they aggressively rotate out of existing positions to allocate to momentum? The answer , according to Goldman, is that although funds carried high net leverage into the bear market decline, they carried similarly high exposure as the market troughed and rebounded. This supported fund performance as the market rallied, offsetting some of the negative beta return generated during the market’s decline.
That said, aggregate hedge fund net leverage calculated based on publicly-available data registered 54% at the start of 2Q 2020, above the 51% exposure at the start of 2020. Exposures calculated by Goldman Sachs Prime Services show a similar dynamic, with gross and net leverage falling alongside the market in late February, but net leverage recovering at the start of the market rebound in late March.
In other words, while hedge funds rotated their exposure to be increasingly concentrated in just a handful of stocks, they did so without much enthusiasm. On the other hand, sensing a Fed bailout, hedge funds also cut net leverage by less, and stopped cutting at a higher level of exposure, than they did during other major market drawdowns in recent years. In 2011 and 2016, funds reduced net leverage during market sell-offs only to find themselves underexposed as equities rebounded. In contrast, funds cut net leverage only modestly during the coronavirus sell-off. Although the market drawdown was exceptionally large, fund manager confidence and risk budgets were likely supported by the widespread ownership coming into the crisis of large-cap Tech stocks and other perceived “winners.
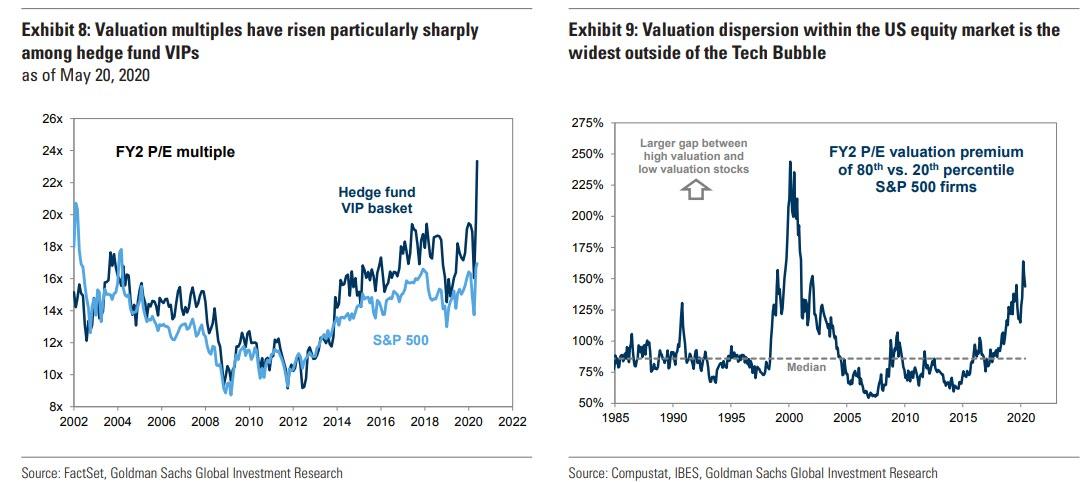
So if widespread concentration of a handful of stocks was the reason for HF underperformance in Q1, what was the offset? The answer is a small subset of what hedge funds were concentrated in, namely the megacaps which form the backbone of Goldman’s Hedge Fund VIP list. As the bank explains, “the outperformance and increased popularity of growth stocks have lifted the valuation of our Hedge Fund VIP basket to a new record, both in absolute terms and relative to the broad S&P 500.”
Of course, this also means that if the broader market is massively overvalued, then the stocks that hedge funds have all piled into to offset the broader market decline have a valuation that is off the charts. And sure enough, the VIP basket’s median constituent trades at 23x consensus 2021 EPS, a premium of more than 35% relative to the S&P 500 multiple of 17x. This, as Goldman’s Ben Snider explains, is consistent with a sharp recent rise in valuation dispersion across the US equity market. The gap in valuations between the highest multiple and lowest multiple stocks is now the widest on record outside of the peak of the Tech Bubble. The rotation of fund portfolios toward already-popular, outperforming growth stocks has also helped lift portfolio concentration and crowding to record highs (see Exhibits 13 and 17 above).
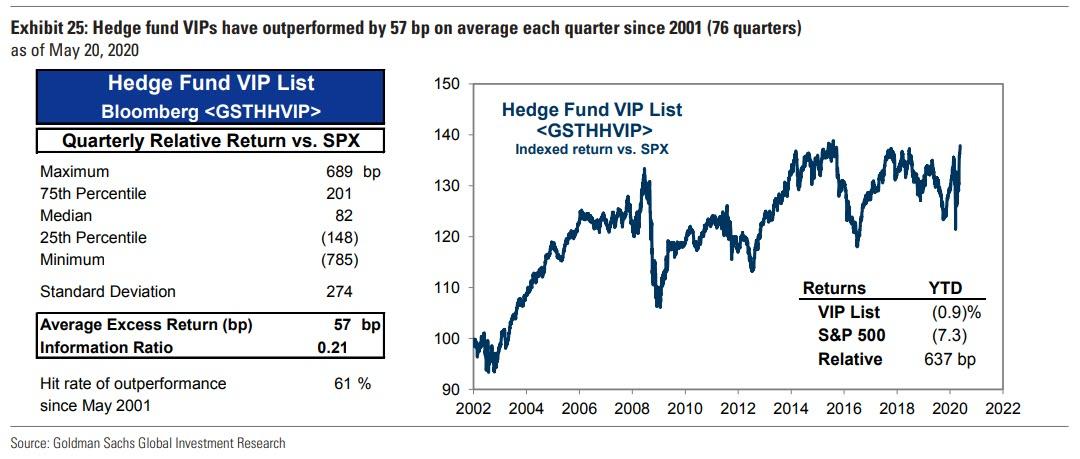
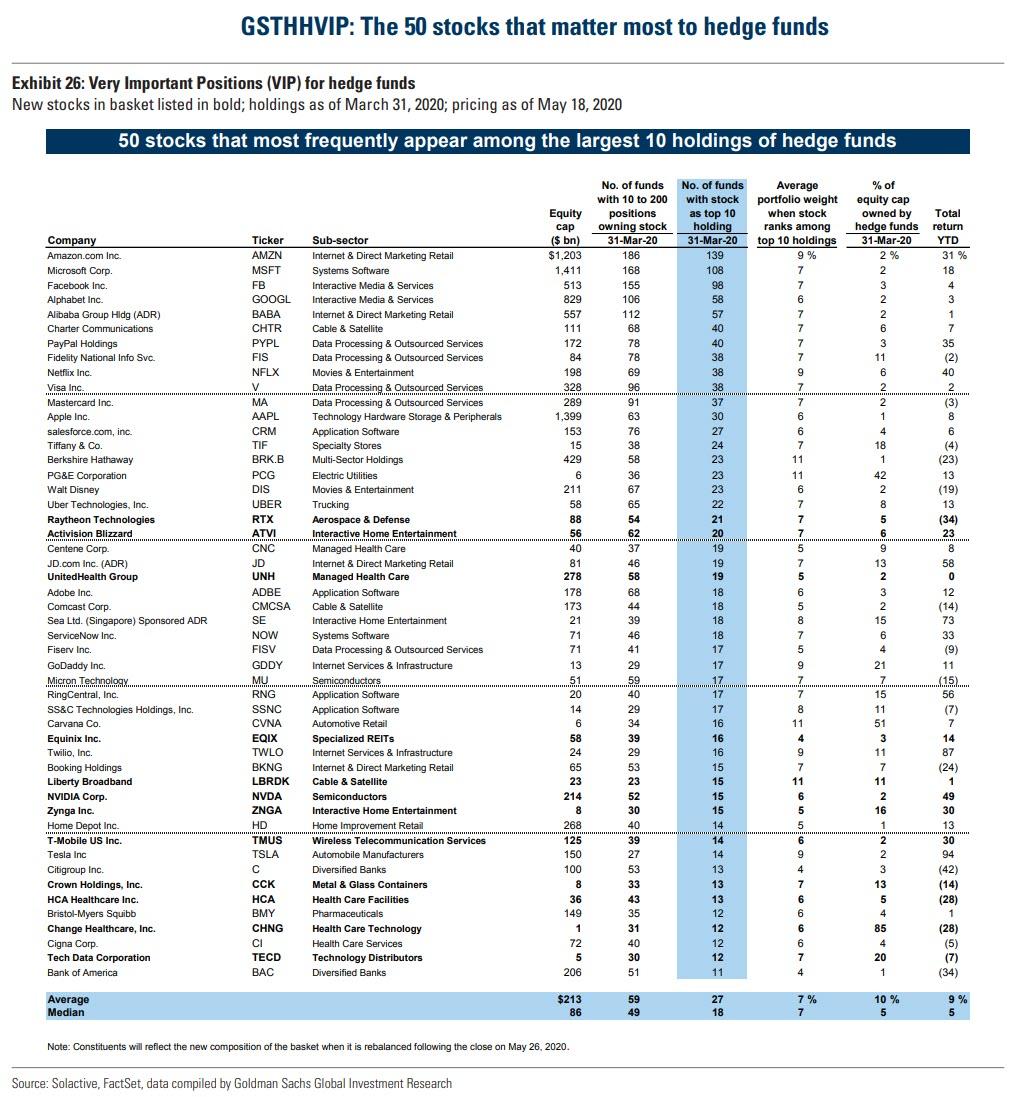
For those who are unfamiliar with the Goldman Hedge Fund VIP list, it contains the top long positions of fundamentally-driven hedge funds. These “stocks that matter most” are the positions that appear most frequently among the top 10 holdings within hedge fund portfolios. From an implementation standpoint, the Hedge Fund VIP list represents a tool for investors seeking to “follow the smart money” based on 13-F filings. By construction, the VIP list identifies the 50 stocks whose performance will largely influence the long side of many fundamentally driven hedge funds. The Hedge Fund VIP basket has outperformed the S&P 500 by 637 bp YTD (-1% vs. -7%) and has outperformed the S&P 500 in 61% of quarters since 2001. The basket has been a strong historical performer, but volatility has surged in 2020: it outperformed the S&P 500 by 5 pp through the market peak on Feb. 19, lagged by 7 pp in the subsequent month as the US entered into a bear market, and outperformed the S&P 500 by 8 pp since the trough on Mar. 23.
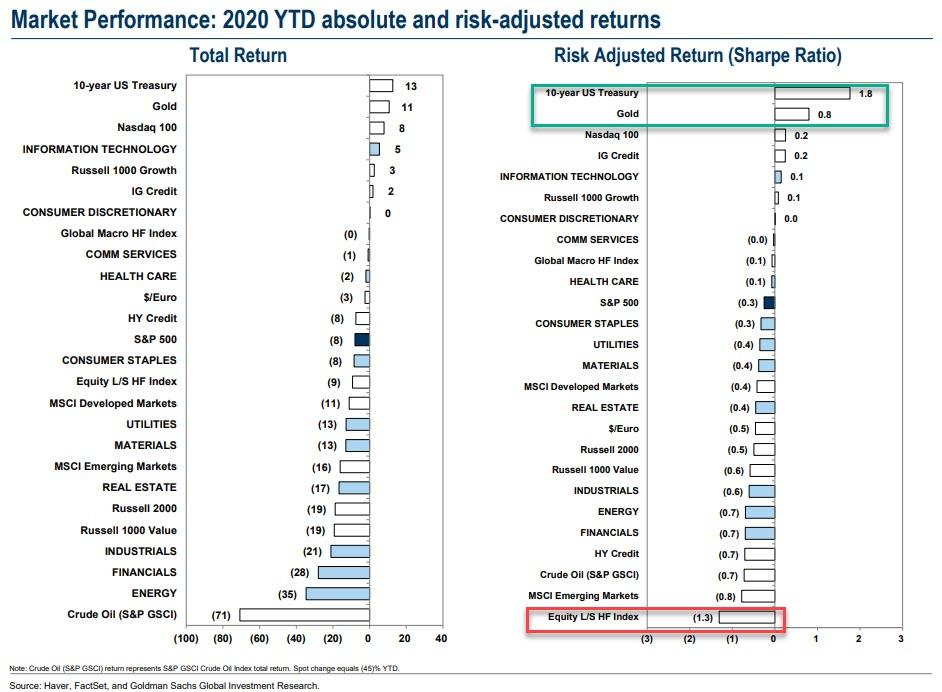
In short, hedge funds may be performing the same as the S&P YTD, but their Sharpe ratio is a complete disaster, so whoever is invested in equity L/S HFs better have nerves of steel. Not for nothing, the equity L/S HF index is dead last in the YTD risk-adjusted return table. Compare that to standouts gold and 10Y TSYs, or even just buying the Nasdaq, and one wonders what is the point of this whole industry anymore?
For those who just have to buy what all other hedge funds are buying, Goldman notes that “12 stocks joined our list of the most popular hedge fund long positions, but this marks the seventh consecutive quarter with the same top 5: AMZN, MSFT, FB, BABA, GOOGL.” The VIP list contains the 50 stocks that appear most often among the top 10 holdings of fundamentally-driven hedge funds. The basket has outperformed the S&P 500 in 61% of quarters since 2001 with an average quarterly excess return of 57 bp (228 bp annually). New constituents: ATVI, CCK, CHNG, EQIX, HCA, LBRDK, NVDA, RTX, TECD, TMUS, UNH, ZNGA.
Below is the latest snapshot of the 50 constituent stocks as of March 31.
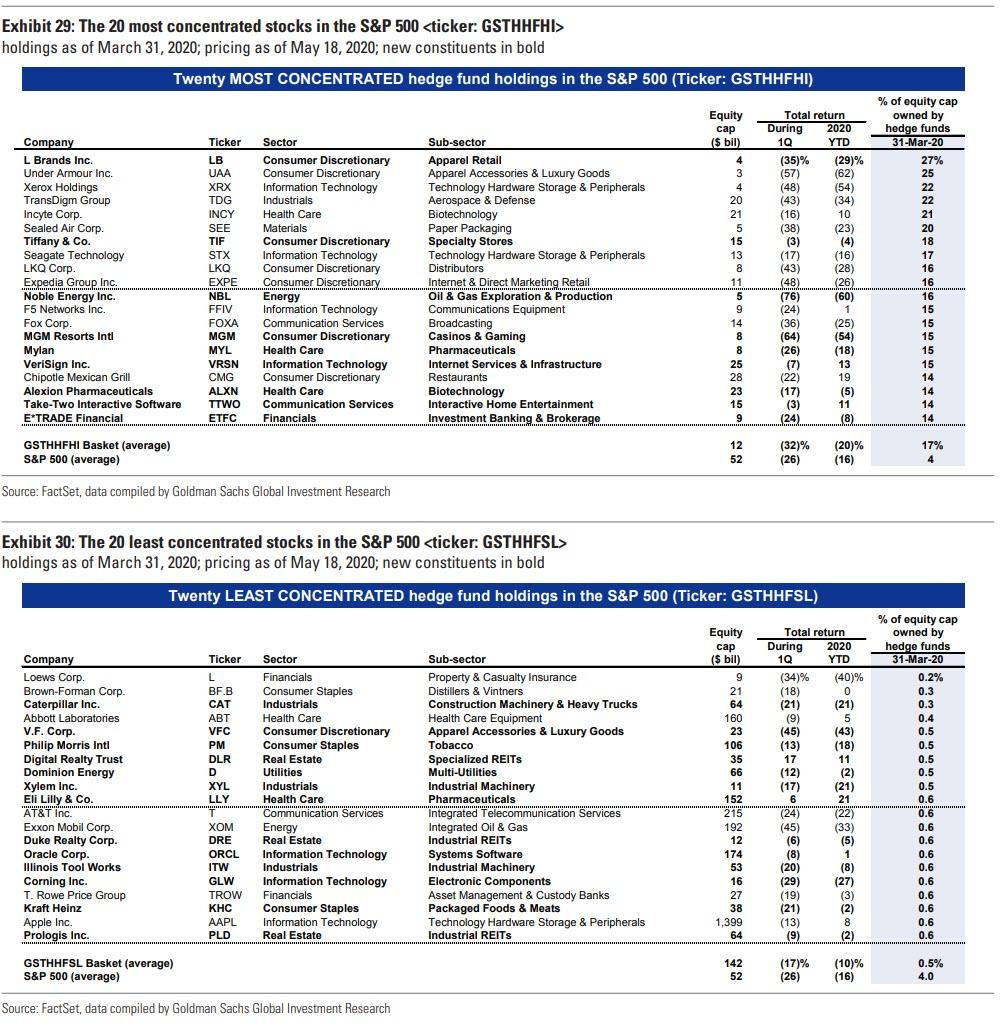
Of course, as noted at the very start, the outperformance driven by the HF VIP basket was more than offset by the underperformance of the most concentrated positions. As a note, Goldman defines “concentration” as the share of market capitalization owned in aggregate by hedge funds. The High Concentration basket is not sector-neutral versus the S&P 500, and the stocks tend to be mid-caps, at the lower end of the S&P 500 capitalization distribution. Hedge funds own 17% of the market cap of the average constituent in the High Concentration basket, 4% of the average S&P 500 stock, and less than 1% of the average constituent in our Low Concentration basket.
Here’s the problem: while the VIP basket trounced the S&P, the High Hedge Fund Concentration basket has lagged the S&P 500 by 17% since the market peak on Feb. 19 (-29% vs. -12%). These stocks have also underperformed in past periods of severe market stress as hedge fund selling weighed particularly sharply on the most concentrated positions.
Which brings us full circle to what we said first back in 2013: short the most widely held, i.e., concentrated names, and go long the most widely held ones, a strategy that has made money every year in the past 7 except for one: 2017.
Here, courtesy of Goldman, is a summary of the 50 most and least concentrated hedge fund positions.
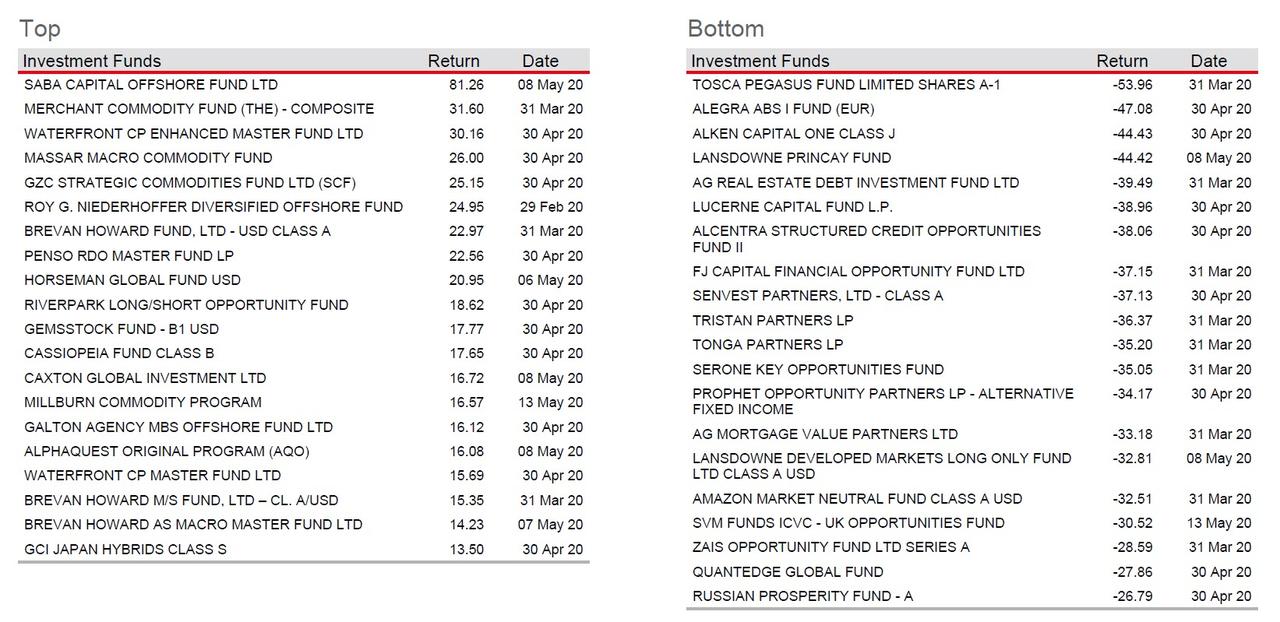
Finally, since we know that the only thing that really matters is performance, here is a snapshot of the Top 20 best and worst performing hedge funds YTD from the latest HSBC report.
