Here’s Why Professional Investors Just Refuse To Play: Market Fragility Is “Off The Charts”
Tyler Durden
Tue, 06/02/2020 – 13:17
Three weeks ago, BofA’s derivative strategist Benjamin Bowler who is rapidly emerging as one of Wall Street’s biggest bears, picked up on one of his favorite topics, namely rising market fragility as a result of constant central bank interventions…
… something we first touched upon back in 2017, writing that “history suggests markets won’t escape economic reality, and that this bear market will be similar in length to that of the ensuing recession, but there is a risk is of wider overshoots, which reconcile more violently in a world still prone to fragility.” For Bowler fragility has become a critical component of assessing assets as it now represents the fourth statistical moment of returns: kurtosis.
Today, with the market disconnect from underlying economic and fundamental reality the widest it has ever been, Bowler refreshes on this topic, writing that “fragility has not only continued to explain the risk faced by asset managers better than volatility itself but that the major drivers of market fragility – risk manipulation by central banks, investor crowding and low trading liquidity – remained intact, if not stronger. ”
Below, Bowler lays out his latest thoughts on why this is the most “fragile” market in history, and what that means for markets:
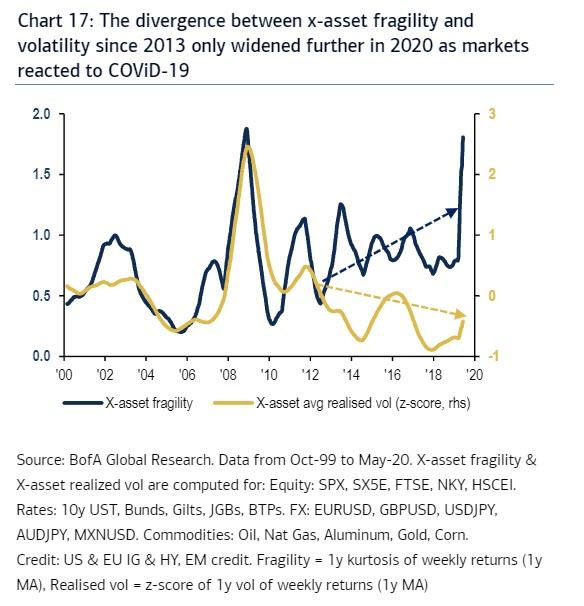
- Fragility and volatility have continued to diverge: Chart 17 shows that from a high level, the divergence between cross asset volatility and cross asset fragility that became apparent from 2013 onwards, has gathered pace in 2020. Notably, while short-term measures of realized volatility have rivaled and in some cases exceeded what was observed in 2008, the record-breaking pace of the volatility reversal since March has meant that a slower moving measure of cross asset realized volatility shows a relatively small uptick in volatility YTD.
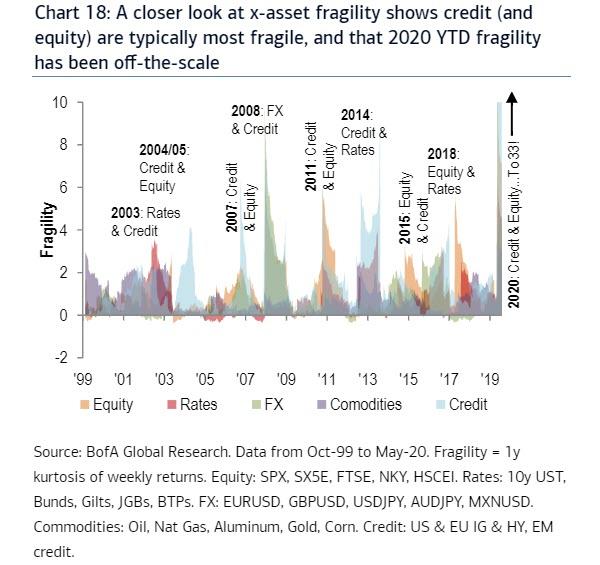
- Credit (& equity) are typically the most fragile historically, including in 2020: Chart 18 shows that in the last 20 years, credit followed by equities have exhibited the highest fragility across asset classes, with some notable exceptions like 2008 (FX).
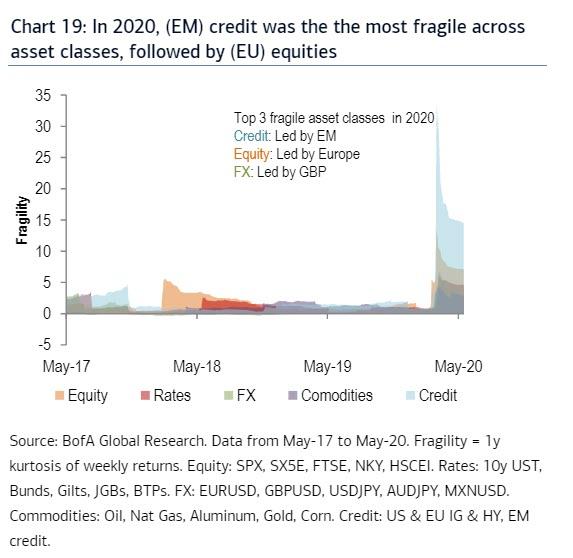
- Moreover, the 2020 story of fragility is one that is literally off-the-chart, with (EM) credit once again exhibiting the highest fragility across assets (Chart 19)
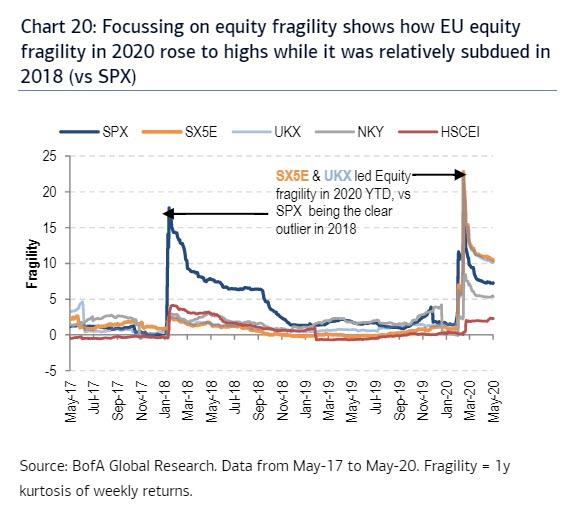
- European equities exhibited the most fragility in 2020 vs global peers: Chart 20 shows that the SX5E and the UKX exhibited the most fragility among major global equity indices in 2020, in stark contrast to the 2018 experience when heightened SPX fragility was a clear outlier.
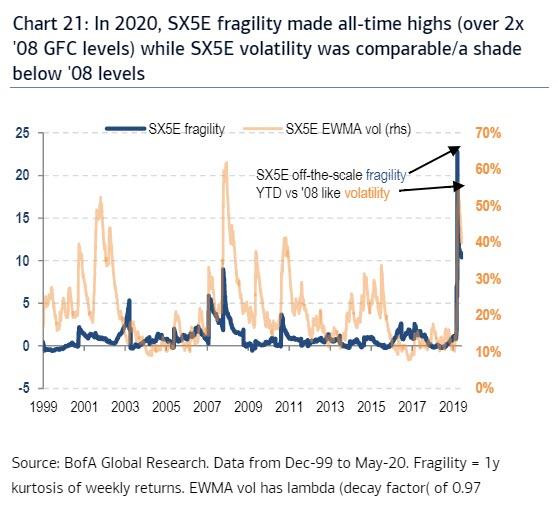
- Indeed, Chart 21 shows that SX5E fragility has made all-time (since the creation of the Euro) highs in 2020, more than doubling its level at the peak of the 2008 GFC. Meanwhile, SX5E realized volatility was a touch less than its historical GFC equivalent.
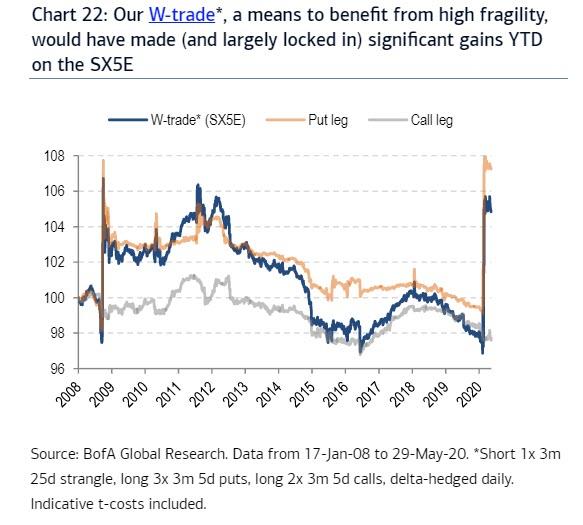
- The W-trade would have been successful in capturing heightened fragility: BofA’s recommended way of gaining from heightened fragility – the W-trade (implemented on indices like the SPX via short 3m strangles and long wider strangles, delta-hedged) – made outsized gains that were ‘locked in’. Indeed, Chart 22 shows that the same is true of the trade implemented on the SX5E, where outsized 2020 gains driven by the put leg were largely preserved through the end of May, despite the sharp reversal in equity volatility.
As Bowler concludes, “convexity isn’t cheap but monitor W-trade entry as fragility is here to stay.”
One other interesting observation: Bowler recently highlighted that SX5E convexity (via skew or the var-vol spread) has been relatively sticky even as vol has collapsed since March. “This suggests that the threshold for the W-trade to be successful in a further shock if initiated currently is relatively high versus history.“
However, as we have discussed on various occasions including most recently two weeks ago, “one of the factors that feed fragility is bubble-like price action when fundamentals are ignored and technical flows or sentiment/policy support belief takes over,” something that according to Bowler and a growing army of professional investors who refuse to participate in this farce of a market, “behind the V-shaped market recovery since March.”
And since the higher stocks rise, the greater the likelihood of another historical collapse, or as Bowler puts it “the longer this goes on, the more susceptible (fragile) markets are to news that challenges the prevailing narrative.” Which explains why algo and robot traders together with oblivious retail daytraders have taken over the market (something we discussed in detail recently).
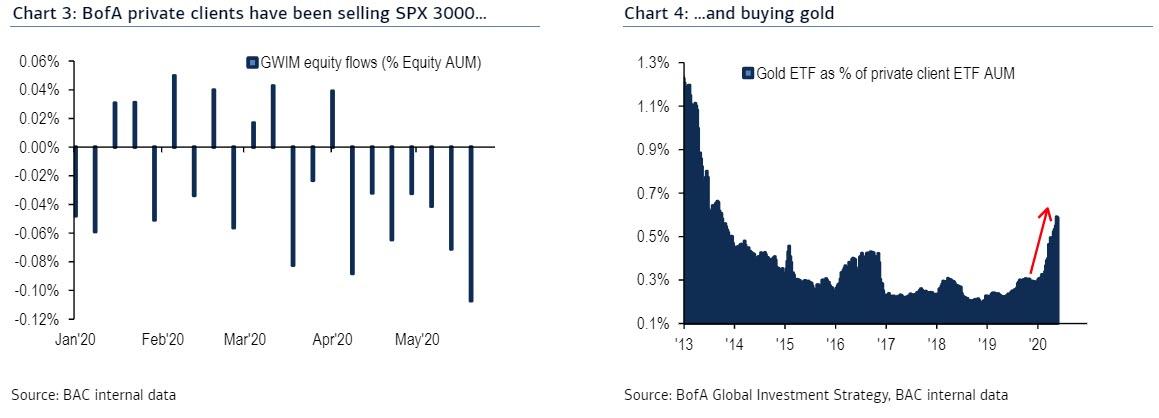
But aside for retail and the systematically minded investors, hedge and mutual funds just refuse to participate. And with a fragility singularity looming, one can see why professional investors continue to dump stocks…
… and buy gold.
