The Staggering “Powell Bubble” In Just One Amazing Chart
Tyler Durden
Thu, 06/04/2020 – 15:50
With three in four finance professionals convinced that Fed is behind the current rally thanks to an unprecedented firehose of liquidity which is anywhere between $8 and $12 trillion based on asset purchases, backstops, and guarantees, there is no denying that what we are experiencing now is a continuation of the bubble spawned by Bernanke in 2008, nursed by Yellen and now desperately defended by the same Powell who back on October 23, 2012 said “I think we are actually at a point of encouraging risk-taking… investors really do understand now that we will be there to prevent serious losses.”
So how does one quantify or visualize just how big the “Powell Bubble” is? While there are many ways to represent the bubble spawned by the Fed across all asset classes which have become the receptacle of the Fed’s unlimited liquidity torrent, but a fascinating one was proposed today by Bloomberg’s Eddie van der Walt who writes that “raw material and equity prices have become severely disconnected” adding that “a correction will probably entail both lower stocks and higher commodity prices.”
As the Bloomberg commodity analyst notes, the Nasdaq is trading at a 152x multiple of the Bloomberg Commodity Index, surpassing the highs seen during the Dot Com bubble by almost a factor of two!
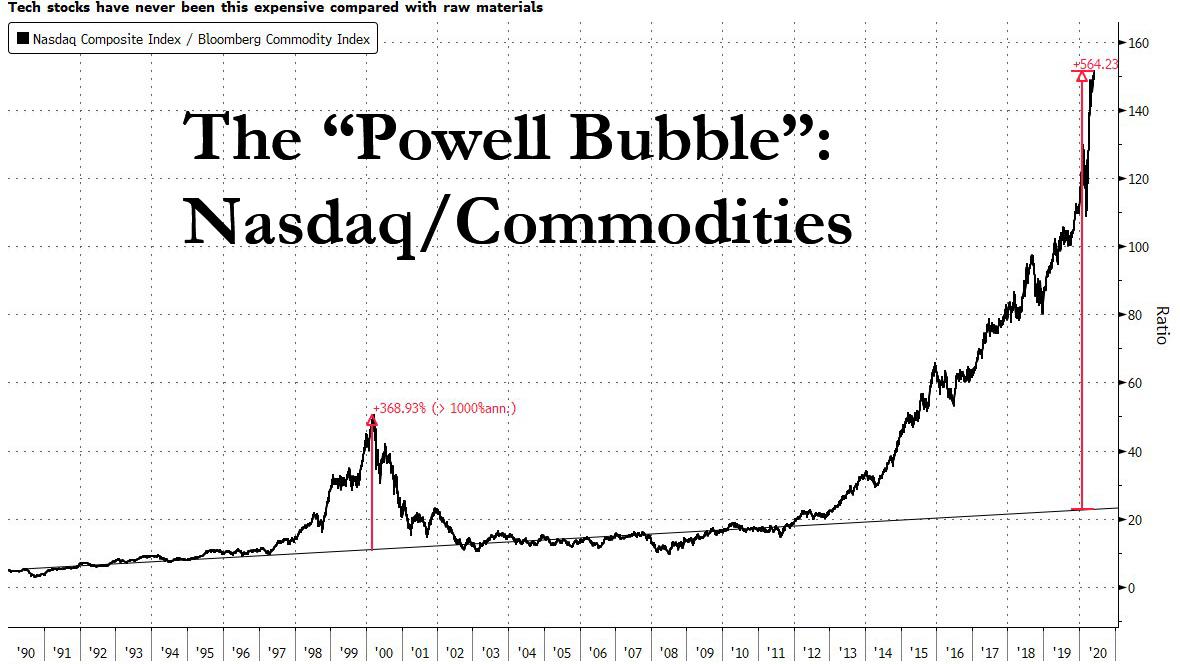
In other words, the bulk of newly created liquidity has flooded into stocks even as commodities – which tend to be a far better representation of the overall economic state – languish. The average ratio since the end of 2001 has been nearer 37. That divergence stems from the Nasdaq approaching record highs set earlier this year while commodities languish near pandemic-crisis lows.
As van der Walt concludes, “And while the tech-heavy shares in the Nasdaq aren’t big consumers of industrial metals and oil, this matters because it shows just how disconnected stock prices have become from the real economy. Something has got to give.”
He’s absolutely right, but that “something” won’t give without an existential fight from the Fed’s Powell: while we excerpted from his comments above, below is all one needs to know courtesy of the Oct 2012 FOMC Minutes, in which Powell explained precisely what is going on:
The market in most cases will cheer us for doing more. It will never be enough for the market. Our models will always tell us that we are helping the economy, and I will probably always feel that those benefits are overestimated. And we will be able to tell ourselves that market function is not impaired and that inflation expectations are under control. What is to stop us, other than much faster economic growth, which it is probably not in our power to produce?
I think we are actually at a point of encouraging risk-taking, and that should give us pause. Investors really do understand now that we will be there to prevent serious losses. It is not that it is easy for them to make money but that they have every incentive to take more risk, and they are doing so. Meanwhile, we look like we are blowing a fixed-income duration bubble right across the credit spectrum that will result in big losses when rates come up down the road. You can almost say that that is our strategy.
Incidentally, for those who want to fight the Fed, well there’s your pair trade: short the Nasdaq and go long the Bloomberg commodity index.