Fed Policy Simplified: Lower, Longer, And ZIRP Until Something (Or Everything) Breaks
Tyler Durden
Tue, 07/21/2020 – 21:05
Authored by Chris Hamilton via Econimica blog,
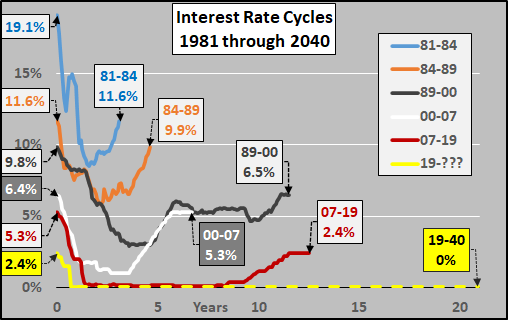
The current interest rate cycle began in August of 2019 when the Fed cut rates from a cycle high of 2.4% to 2.1%. The Fed was then fighting the “repo-crisis” in which the Fed was incapable of setting interest rates…and gasp…free-market based interest rates were the result. And, shocker, they were not “lower for longer”. So, just thought put interest rate cycles in perspective and detail why I anticipate this will be the longest and lowest interest rate cycle with likely zero recovery of those rate cuts.
To begin, the chart below shows interest rate cycles from 1981 through 2020 (and likely through 2040)…and note they grow progressively longer, starting and ending lower, and with less interest rate recovery. Based on this pattern and the macro’s driving this, this current cycle is likely to be decades at zero (or more likely moving to NIRP) with no rate hikes.
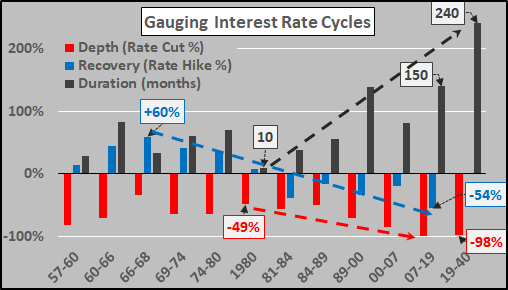
To gauge the changing dynamics of the interest rate cycles, the chart below details the DEPTH of the cut (the percentage from starting rate to cycle low rate), the DURATION (the number of months from initial rate cut to initial rate cut of the next cycle), and the RECOVERY (how much rates are hiked in the hiking phase from the cycle low rate). Again, the depth of cuts moves progressively greater (essentially 100% for last two cycles), duration stretching from less than a year to over a decade, and recovery moving from outright rate hikes to less than 50% recovery of previous cuts. Again, this the current cycle, we already have 100% cuts and I anticipate something on the order of twenty years of zero rates meaning zero recovery.
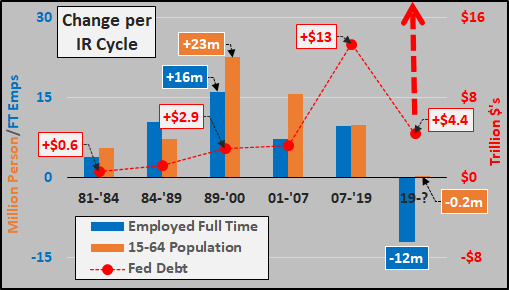
To put this into perspective, below I show the change per interest rate cycle in full time employees, working age population (15 to 64 year-olds), and federal debt. Obviously, the cycles are of differing years, but still note the symmetry in the inverse relationships of rising interest rates/minimal debt during periods of high working age population growth…and falling rates to allow reliance on debt during minimal working age population growth. In just eleven months of the current interest rate cycle, federal debt has already risen by $4.4 trillion (more than any entire cycle prior to ’07) while working age population is declining (not due to Covid-19 but decades of negative fertility coupled with fast declining immigration since 2008, essentially hitting zero in 2020). The ZIRP policy coupled with minimal working age population growth (resulting in minimal to no jobs growth over this cycle) will mean a blow-out of federal debt unlike anything nations outside of Zimbabwe or Venezuela have ever seen.
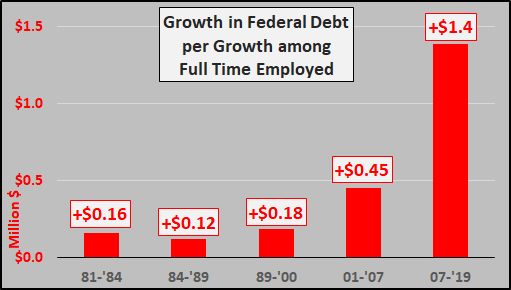
To quantify the situation, the chart below shows the parabolic rise in the growth in federal debt per the net growth per full time employee. I anticipate this current period will see something like a ten fold increase in the growth of federal debt per full time job net gained as debt soars and the US struggles to simply re-employ those who have lost their positions.
Usually I’d wrap it up by showing the change per interest rate cycle…but it’s late and you don’t pay me enuf to get that kind of service…so, below are the changes per presidential term since Reagan took office in January of 1981 (under Trump, I assume by inauguration day, January 2021 federal debt will be sitting at $28.2 T, GDP of $20.6 T, Fed BS of $7.8 T). And I assume all three of the trend arrows below will be continuing their path regardless a Trump or Biden victory.
Invest accordingly.
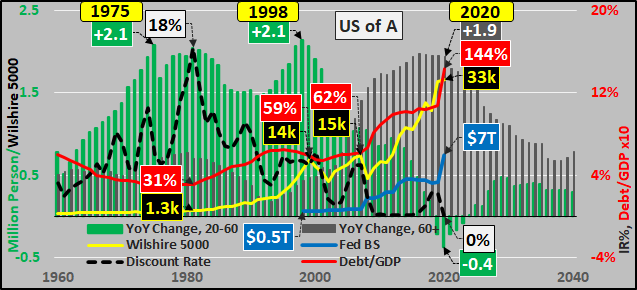
Bonus Chart – Demographic driven interest rates incenting ever more debt / asset inflation, supported by unlimited Federal Reserve balance sheet expansion.
Regardless Trump or Biden, MMT and basic universal income are here to stay…unless somebody notices we’re broke, the markets are a farce, the dollar is garbage, and debt in a depopulationary/deflationary/depressionary world is toxic!?!
