 By David Smith
We tend to spend a lot of time looking into the rearview mirror, especially when under duress.
Connected to this is something psychologists call “recency bias.” This simply means that what has happened in the near to intermediate past tends to inform and influence us as to how we should behave in the future.
The 2011 to early 2019 precious metals bear saga was broken only by a six-month bull hiatus in early 2016 – which then gave most of the rise back over the next two years!
Now, in spite of some very powerful evidence to the contrary, the general investing public still questions both the validity and upside potential of physical precious metals and the share prices of producing miners.
My premise today is that the physical gold and silver market has fundamentally changed. And if you intend to gear up for and stay on this evolving multiple-year historic run, you had best do the same.
Significant increases in demand – especially in the West – tend to begin subtly with large purchase and storage by high net-worth individuals.
Over the last year or so, gold and silver ETF share inflows (which are supposed to be backed by growing amounts of metal) have been surging, setting monthly records time after time. In just the last two years, silver bullion held in trust by these ETFs has risen from a 22-million-ounce loss in 2018, to an 81.7-million-ounce gain last year… and ETF holdings are still marching higher.
Ounces vaulted under the SLV, which holds almost one-half of the silver owned by the world’s ETFs, is published daily and has become a must-follow item for speculators and investors alike. As such, the Trust’s mission of mirroring the metal’s price serves as a proxy for silver investment demand.
By the middle of July, as reported by Adam Hamilton, SLV held over 516 million ounces of silver! Adam believes that this current rise is caused by institutional investors, stating that this “near-vertical holdings build has been highly consistent and disciplined. It has happened whether silver is rising, falling, or grinding sideways.”
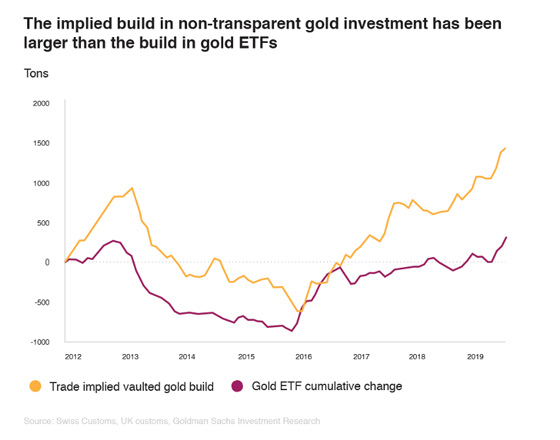
There is an interesting discrepancy going on between the amount of gold going into ETFs of record, and the “implied build” taking place in other venues. These take the form of private purchases held either in non-banking vaults, private storage facilities, or (quite literally) holes in the ground.
See: 177 Different Ways to Generate Extra Income

In addition, Central Banks, probably the largest buyers of gold over the last decade (having been net sellers for a number of years prior to the switch), have become unremitting accumulators. For all their public posturing about “gold not paying interest,” gold being “a barbarous relic,” or a “pet rock,” they certainly have been doing just the opposite!
The most profound exceptions to this have been, when at the start of the (so-far) 20 year bull run, UK bureaucrat Gordon Brown managed to sell fully half of his country’s reserves at an average price of $275, which turned out to be the absolute low of the previous two decades.
Immortalized as “Brown’s Bottom,” his farcical action cost his countrymen billions of dollars in lost value, as gold rocked up to its current level of over $1,800. No doubt this will continue to be “the gift that keeps on taking” as gold adds more thousands of dollars per ounce.
But the top prize for “thinking backward” must go Canada, which although it is the world’s 8th largest gold producer, holds next to nothing. Their puny “reserves” could probably fit on a sturdy coffee table!
The large buying build in both gold and silver have reached the stage where individual investors are starting to realize that, far from being a flash in the pan last spring, elevated premiums, long delivery delays, and difficulty in finding metal at all are becoming the norm.
My suggestion: Expect these trends to persist and become noticeably worse as we move into the fall months, typically one of the strongest time frames for both metals.
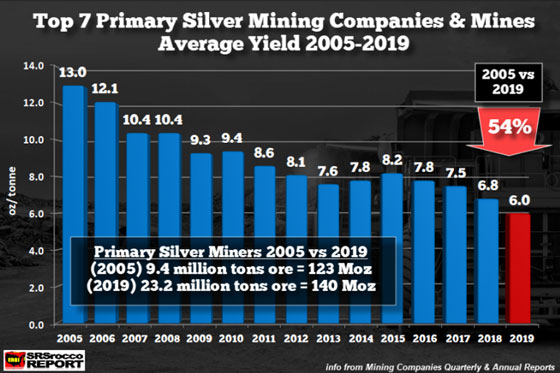
The biggest decrease in silver mine supply in recorded history – going back to the 1940’s – has taken place during the last four years (2017-19, CPM Group)! And this was pre-COVID.
As Jeff Clark notes, in 2019, only a single new primary silver mine came online anywhere on the globe. Not to mention that due to the pandemic this year, we can expect a further 10-20% production decrease.

If you have yet to acquire “enough for your needs,” then you’d better get on the stick. Decide what your acquisition plan should look like, how much you intend to budget, what you should buy, and how often you plan to do so. Then don’t fail to do something about it!
Adam Hamilton’s latest essay concludes with the following paragraph.
The resulting enormous SLV-holdings builds are unprecedented, forcing them vertically… unleashing a powerful virtuous circle for silver, with investment buying driving silver higher attracting in even more investors. Silver still has a long runway higher to mean revert back up to historic norms relative to gold. And the Fed’s epic monetary inflation should keep demand high.
By just about any metric, the odds overwhelmingly indicate that the historic silver (and gold) institutional and speculator demand now being witnessed, will lead in due time to a virtual “gold rush” by individuals like you and me for what’s left over.
So don’t keep waiting for lower paper prices in hopes of getting some cheap metal.
As investors with this mindset found out last spring, holding out for $12 silver simply meant they had to pay $22, as opposed to being able just a few months before to get it at $17, which included only a single dollar premium over spot.
So don’t be zinc penny wise and copper pound foolish!
Real money – gold and silver – unlike the fake stuff in your wallet, holds and builds value as a counterweight to the ongoing depreciation we’ve all been experiencing in fiat currency purchasing power.
And oh, did I mention that just since 2000, those “paper promises” you’ve been collecting have declined in value by about 44%?
As for gold and silver since then? Try working the math on scratch paper with these statistics. Gold in 2000: c. $265; Today: c. $1,863. Silver in 2000: $4.75; Today $22.37. On the way for both over the next few years to _?__ (fill in the blank).
David H. Smith is Senior Analyst for TheMorganReport.com, a regular contributor to MoneyMetals.com as well as the LODE Cryptographic Silver Monetary System Project. He has investigated precious metals’ mines and exploration sites in Argentina, Chile, Peru, Mexico, Bolivia, China, Canada and the U.S. He shares resource sector observations with readers, the media, and North American investment conference attendees.
Subscribe to Activist Post for truth, peace, and freedom news. Send resources to the front lines of peace and freedom HERE! Follow us on SoMee, HIVE, Parler, Flote, Minds, and Twitter.
Provide, Protect and Profit from what’s coming! Get a free issue of Counter Markets today.