“The Greatest Pull-Forward In History”: Why This Recession Is Different, Similar, & Worse
Tyler Durden
Tue, 08/11/2020 – 18:45
Authored by Eric Basmajian via EPBMacroResearch.com,
-
The COVID recession resulted in the most significant “pull-forward” of income growth in modern history.
-
An unprecedented amount of debt was used to plug a record output gap.
-
This recession is different because income growth increased as opposed to declined. The similarity comes from the use of debt capital to blunt the negative impact of deflation.
-
The outcome of the recession will ultimately be worse as the level of public and private indebtedness has breached all critical thresholds and will now have a non-linear impact on economic growth.
-
Overusing one factor of the production function, specifically debt capital, has diminishing marginal returns and will result in the weakest expansionary income growth in the years to come.
A long history of recessions, dating back to the founding of the republic, has allowed us to create a template for a typical downturn in the economy. The COVID recession, mostly thanks to unprecedented government action, has distinct differences from the historical recessionary outline.
While differences appear large on the surface, a more in-depth analysis reveals a consistent fact-pattern and one that clearly emphasizes why this recession will be more damaging. We know that the “shock” to the economy was among the worst ever experienced, but here I am referring to the recovery that will undoubtedly take place when discussing why this recession will be “worse.”
Typically, during recessions, income falls for the average population.
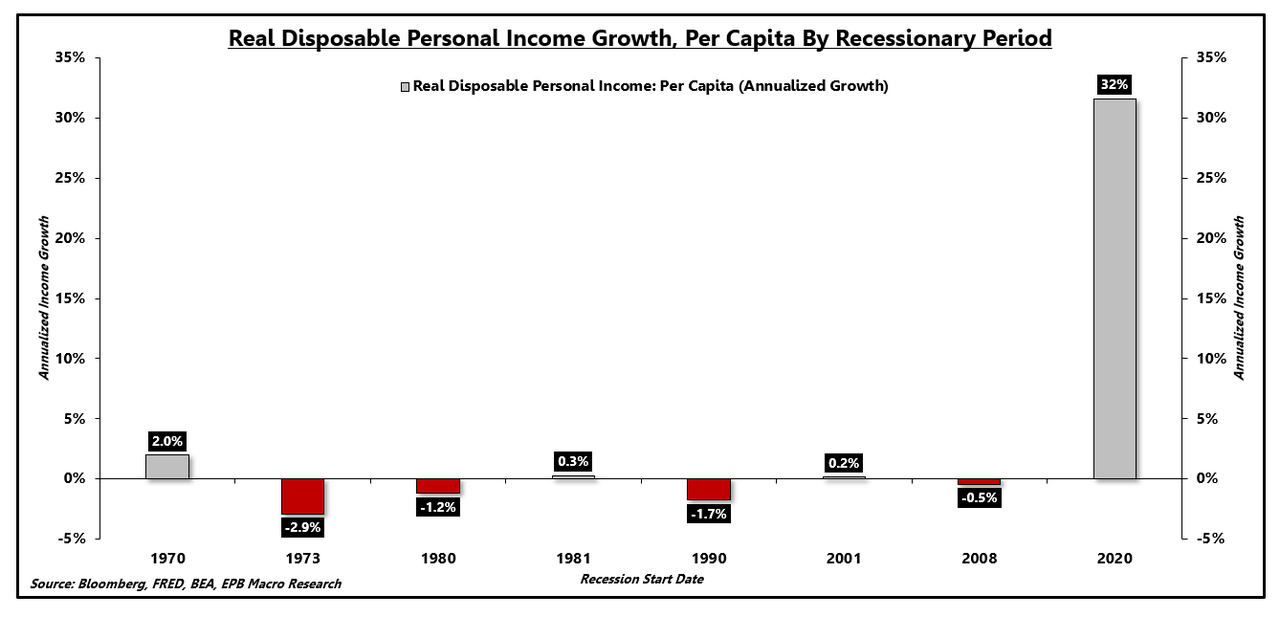
The chart below shows seven recessions before the COVID recession with the annualized rate of real disposable income growth per capita during each recession. Prior to the COVID recession, the average recession brought income growth of -0.54%. In other words, incomes declined during the average recession.
In 2020, due to one-time stimulus checks and massively boosted unemployment benefits, so far, we have seen 32% annualized growth in income during the recession.
Real Disposable Personal Income Growth: Per Capita (Annualized Growth):
Source: Bloomberg, FRED, BEA, EPB Macro Research
This recession is clearly different because income growth went up as opposed to going down, a significant deviation from the standard recessionary outline.
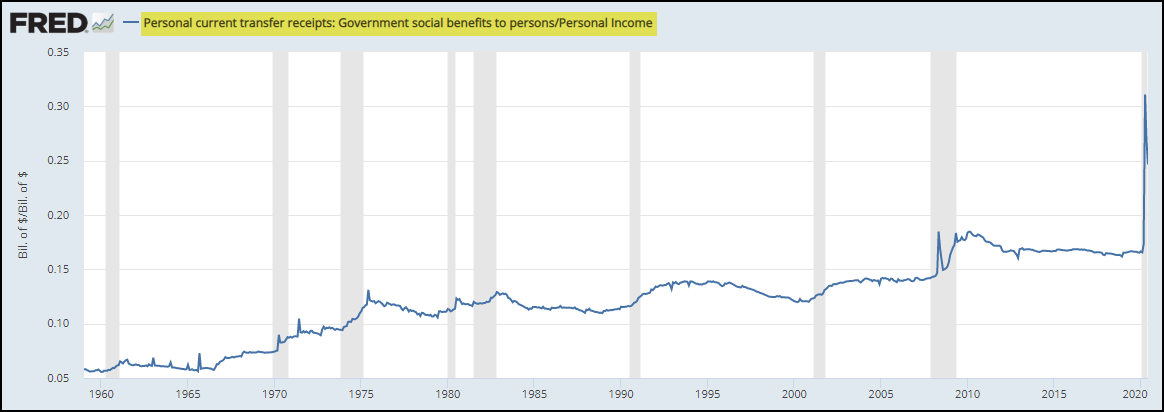
As noted, income growth soared due to government transfer payments, namely one-time stimulus checks and enhanced unemployment. Total government transfer payments reached a record 30% of total income during the crisis and has since cooled to about a quarter of total personal income.
Government Transfer Payments As A % of Total Personal Income:
Source: FRED
At this point, we are all aware that this massive rise in income through transfer payments was facilitated by an enormous increase in public sector debt. Many have pointed out that this is akin to a “free lunch” as long as the Federal Reserve buys the debt issued to the public. This is a highly flawed analysis that disregards many core pillars of macroeconomics and a careful study of the existing problems associated with extreme levels of overindebtedness.
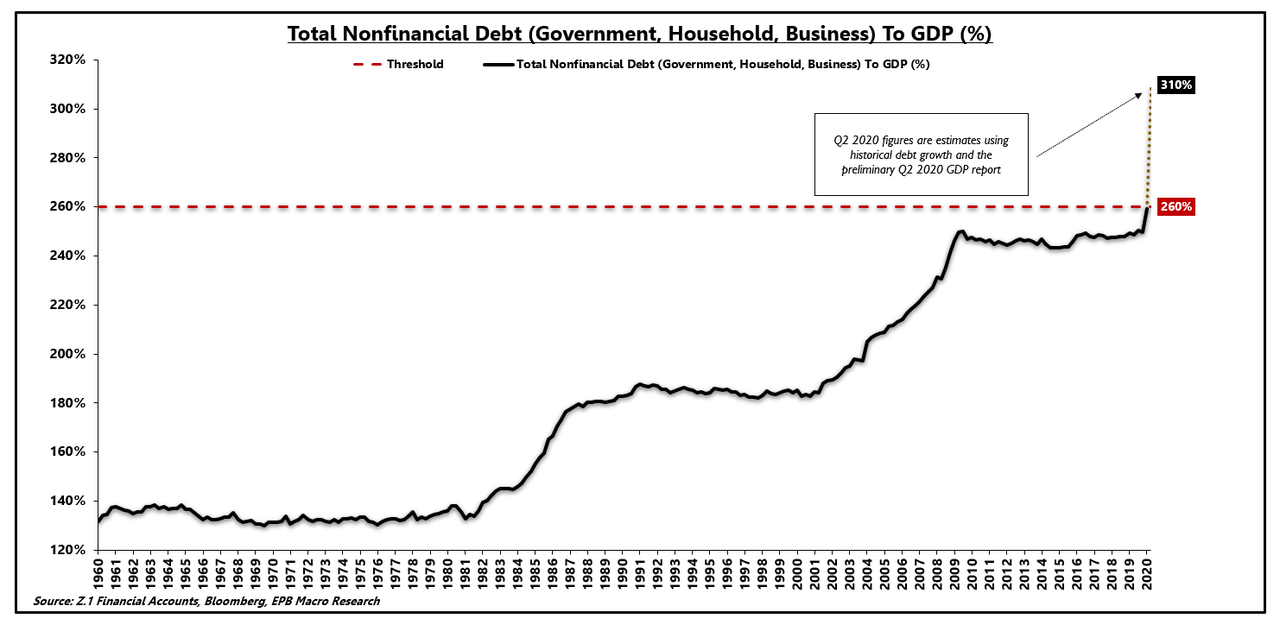
Using assumptions which are likely too low, total nonfinancial debt as a % of GDP will surge to 310%, breaching the cumulative threshold outlined in the BIS paper, “The Real Effects of Debt,” the level at which debt starts to have a nonlinear negative impact on economic growth.
It is important to note that the paper specifically excluded any mention of massive inflation as a result of overindebtedness and instead emphasized the drag on growth.
In fact, there have been dozens of papers written about the impacts of extreme levels of debt; virtually none cite high inflation as the result unless the central bank’s liabilities become legal tender, something discussed at the conclusion of this note.
Total Nonfinancial Debt As A % of GDP:
Source: Z.1 Financial Accounts, BEA, Bloomberg, EPB Macro Research
Furthermore, assuming that the Central Bank can buy the debt of the government, thereby allowing fiscal policy to generate inflation, disregards the well documented diminishing marginal returns proposition.
The production function says economic output is determined by how technology interacts with the factors of production: land, labor, and capital.
Overusing one factor of production has substantial evidence of diminishing marginal gains.
With total nonfinancial debt to GDP soaring to 310%, the US has eclipsed all peaks in total debt dating back to the 1800s.
Clearly, we are overusing debt capital, and more specifically, government debt capital.
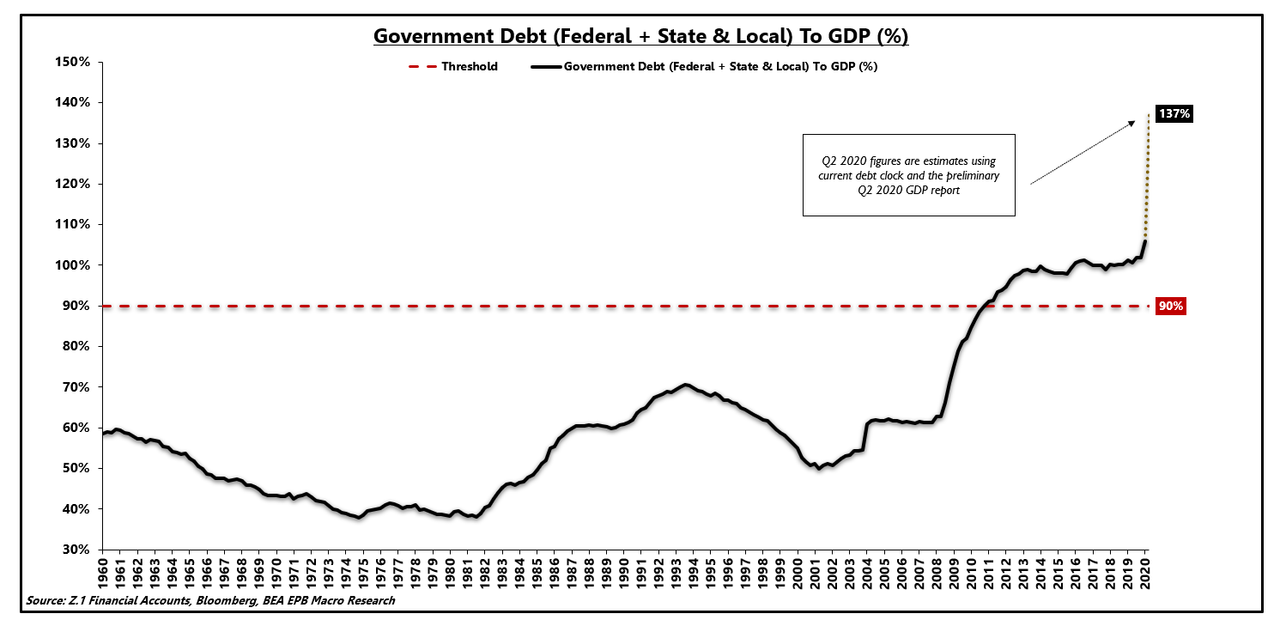
Government debt as a % of GDP has risen to levels that are significantly above the threshold for diminishing marginal returns yet we continue to believe that more is more, dismissing the evidence that more government debt, regardless of the use and the balance sheet on which it resides, will have a nonlinear negative impact on economic growth.
Government Debt As A % of GDP:
Source: Z.1 Financial Accounts, BEA, Bloomberg, EPB Macro Research
Debt is simply a pull-forward of future consumption or rather an exchange of current consumption at the expense of future consumption. We are in the process of the greatest pull-forward of demand in history, and we continue to believe that because we are using “more” debt, or that because it is directed to a particular group of people rather than another group, that we can bypass the well-documented evidence of diminishing marginal returns.
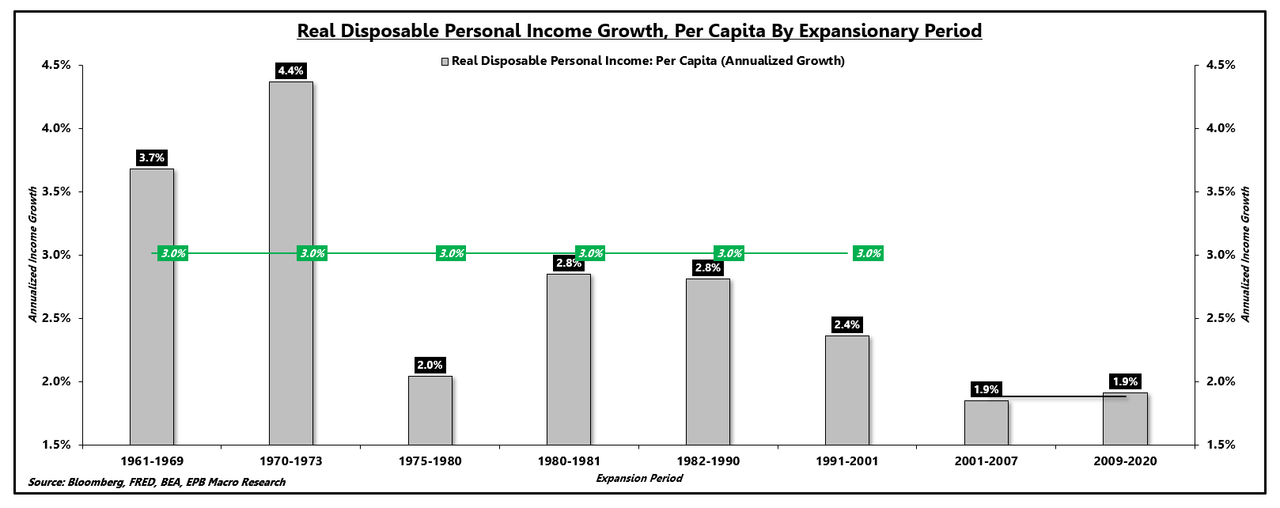
To see the evidence of diminishing marginal returns on full display, we can track the rate of real personal disposable income growth per capita, during only expansionary periods, throughout a period of time in which debt capital has been highly overused.
From the 1960s through the early 2000s, real personal disposable income growth per capita increased at a 3.0% annualized rate during expansionary periods. After the turn of the century, we lost 36% of our trend income growth, falling to just 1.9%. Many factors contributed to this decline, but diminishing marginal returns and an overuse of debt capital are among the main culprits.
Real Disposable Personal Income Growth: Per Capita (Annualized Growth):
Source: Bloomberg, FRED, BEA, EPB Macro Research
Now, we have elevated debt as a percentage of the economy to levels we have not seen before in the United States. This development has made many uncomfortable and caused analysts to throw out various forecasts regarding inflation and a collapse of the currency. We have evidence from abroad, however, of total nonfinancial debt at levels above 300%. The results affirm the principle of diminishing marginal returns as excessive debt overhangs lead to disinflation, lower velocity, and weaker economic growth, regardless of the use.
Using debt capital to boost income growth, even if the debt is swapped for overnight reserves by the Central Bank will fail to generate a sustained rise in velocity over many years to come as the private sector will be crowded out and get away with paying lower income growth as it is subsidized by the government.
Furthermore, relying on government-based income will also then put the burden of “income growth” on the government. If the government starts to make $1,000 monthly payments a regular occurrence, in order to achieve 2% income growth at the end of ten years, these payments will have to exceed $1,200 per month.
Unfortunately, economics is complex, and the existence of a Central Bank has never guaranteed a free lunch. The trend level of income growth during expansionary periods has steadily declined as the economy has become grossly over-indebted.
Now that we have pulled forward income growth into the recessionary period to plug a record output gap, the economy will struggle to gain its footing independent of government support.
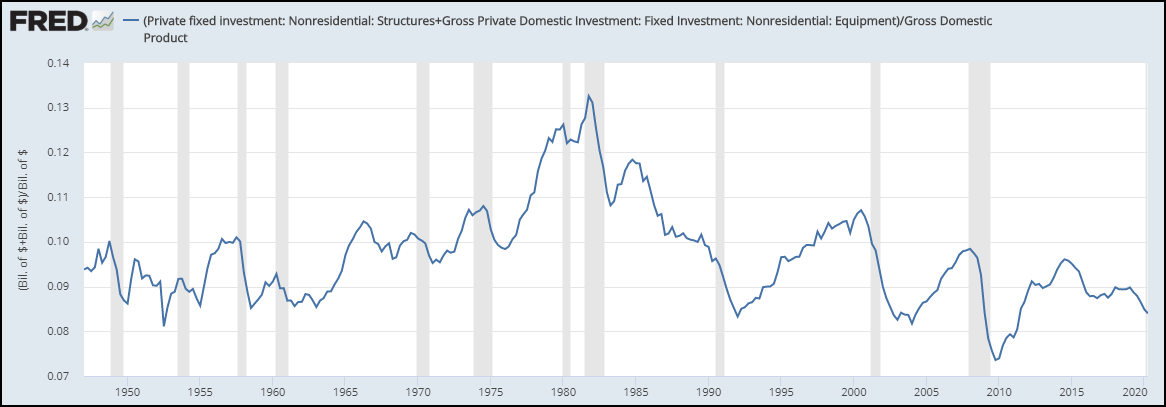
A lack of investment in structures and equipment ensure that the velocity of money will remain weak as a negative net national savings rate coupled with a lack of investment will begin to erode our existing capital equipment.
Private Nonresidential Fixed Investment: Structures & Equipment As A % of GDP:
Source: FRED
For many years, the solution to economic troubles has been bigger government stimulus packages. $1 trillion has become $2 trillion, and the last $2 trillion package lasted less than half a year. The evidence of diminishing marginal returns is again on full display as each stimulus effort is even more fleeting, requiring more extensive programs with greater regularity.
As Dr. Lacy Hunt said in his recent podcast with Grant Williams, “economics is not accounting. We have to grapple with nonlinearities.”
Income growth has increased during this recession, a distinct difference from the normal recessionary template. The use of debt capital, specifically government debt capital, to blunt the impact of deflation is a page out of the same playbook the economy has been using for several decades.
The resulting degradation of income growth during the next expansionary period will be worse than prior episodes as we have pushed the level of indebtedness passed all critical and well-studied thresholds.
We should continue to prepare for anemic real income growth and the knock-on effects that dynamic will bring to asset prices.
* * *
EPB Macro Research provides macroeconomic analysis on the most significant long-term and short-term economic trends, as well as the impact on various asset prices, including stocks, bonds, gold, and commodities. EPB Macro Research provides a low volatility monthly asset allocation model that translates the economic research into an actionable portfolio of ETFs. Click this link for a 14-day FREE TRIAL
