A Historical Divide: A 160-Year View Of The Gold-Oil Ratio
Tyler Durden
Fri, 11/06/2020 – 19:20
2020 has ushered in a new era of prices for two historically significant assets – gold and oil.
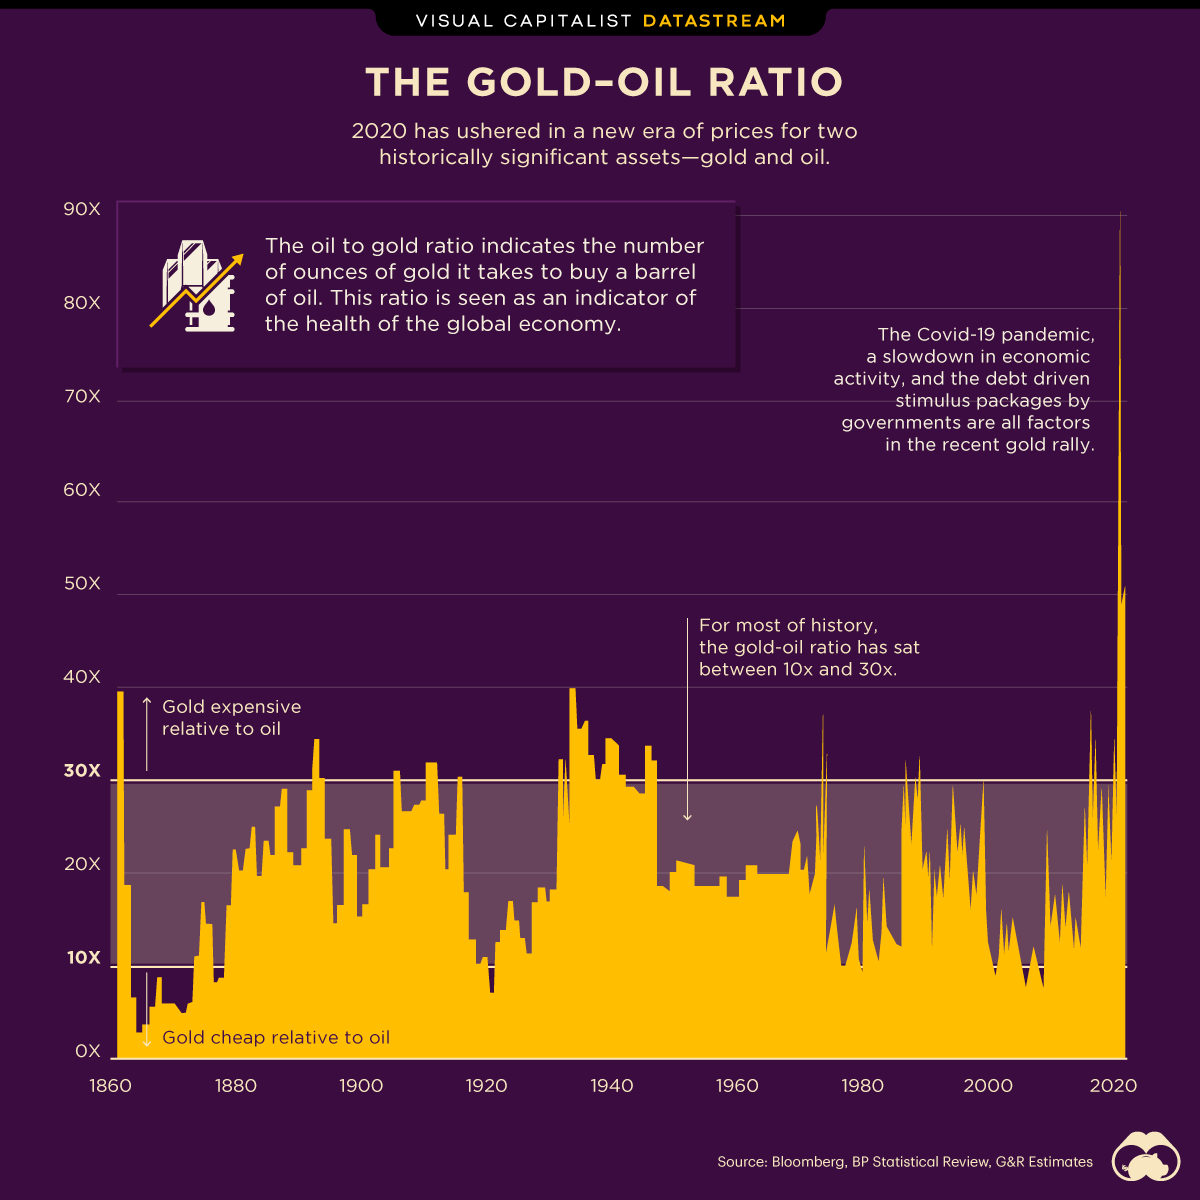
The market has driven the pair in polar opposite directions breaking historical patterns. This year, as Visual Capitalist’s Aran Ali notes, gold brushed above $2,000 an ounce, while oil futures even went temporarily negative in the spring. The gold-oil ratio tells us how many barrels of West Texas Intermediate (WTI) are needed to buy an ounce of gold, serving as a price-based indicator of the relative value of these two important assets.
Historically, the ratio has averaged between 10:1 and 30:1, This year it brushed above 90:1…
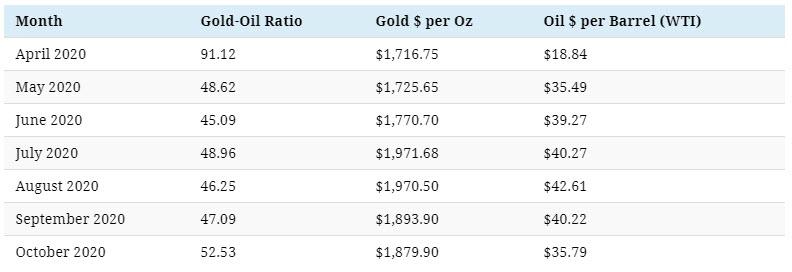
Here’s a look at the price of gold and oil over the last 6 months:
The Gold Story
Traditional investing mantra tells us gold acts as an alternative investment, a haven if you will, that appreciates in price during tumultuous economic and financial times.
Its limited quantity and physical storage properties serve as a hedge to much of modern finance that is increasingly digital.
The COVID-19 pandemic, a subsequent slowdown in economic activity, and the debt-driven stimulus packages by governments globally are all factors in the recent gold rally.
The Oil Story
At the other end are the oil markets, which face both long and short-term headwinds. Long-term demand for oil has dwindled gradually as societies buff up their alternative and green energy initiatives.
Shrinking activity during the pandemic was the short-term shock. Combined, the outcomes include oil futures going negative in spring, Chevron reporting a net income loss of $8.3 billion in the second quarter, and Exxon’s dumping from The Dow.
As markets adapt to the volatile nature of 2020, only time will tell what the future holds for the gold-oil ratio.
* * *
Source: Goehring & Rozencwajg: Top Reasons to Consider Oil-Related Equities report and MacroTrends. Notes: Data is as of October 2020.

