Is This A Bear Market Rally Or A New Bull? BofA Has The Answer… And What Happens Next
With the S&P trading nearly 800 points – or a whopping 30% – above its March 23 lows, the divergence in opinions whether this is a new bull market or merely a massive – and the fastest ever – bear market rally ever, propped up by trillions in central bank liquidity and fiscal stimulus, has never been greater.
We won’t go into details covering the key arguments of either camp (we have done that on numerous occasions in the past, and urge readers to read the latest reports by the chief equity strategists of Goldman, David Kostin, and Morgan Stanley, Michael Wilson to compare just how stark the variance in outlooks is among the two most widely followed Wall Street strategists) and instead we will go straight to what may be a remarkably accurate answer to this dilemma that is keeping Wall Street up at night.
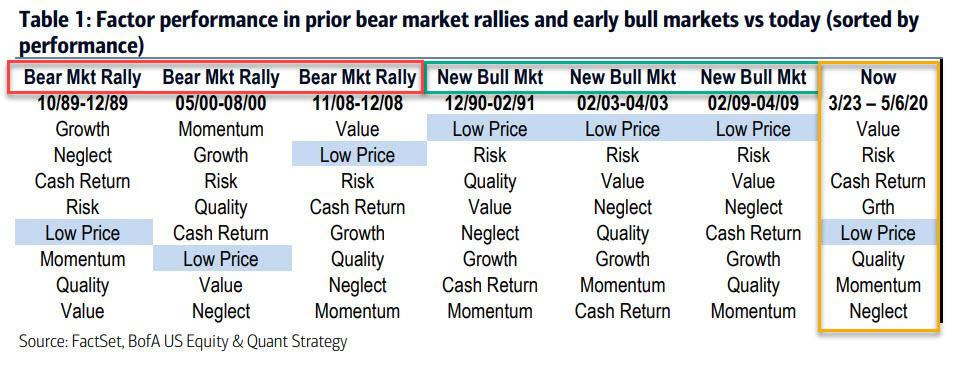
In determining whether March marked the beginning of a real bull market (like March of 2009, March of 2003 and Jan of 1991) or a bear market rally (Nov 1989, June 2000 and Dec 2008), BofA’s quant team conveniently notes that factors can help. Consider that during the early stages of each of the prior real bull markets, the bank’s Low Price factor – read “dollar stocks”, or “distressed equities” – was the best performing factor, but did not lead in bear market rallies.
Alternatively, prior bear market rallies saw mixed leadership, and “Low Price” traditionally was outperformed by such factors as Value, Momentum and Growth.
How about the current rally?
Since 23 March lows, Value (Price/Book and Fwd P/E) and Risk (Estimate Dispersion and Beta) have led. But it is the mediocre performance of Low Price stocks, i.e. distressed equities from the bottom, which to BofA suggests that this is, indeed, just another bear market rally.
BofA’s conclusion is validated by a recent report from SocGen’s own quants, led by Andrew Lapthorne, who notes that “after a record low in March, the market has surged in a short order, registering a stunning 31% gain in a matter of a month. Given the overall negative undertone from the economic challenges ahead, the dramatic reversal of global markets after the pandemic lows is more puzzling, as it also implies an all clear victory against the silent enemy and a return back to the pre-pandemic normality.”
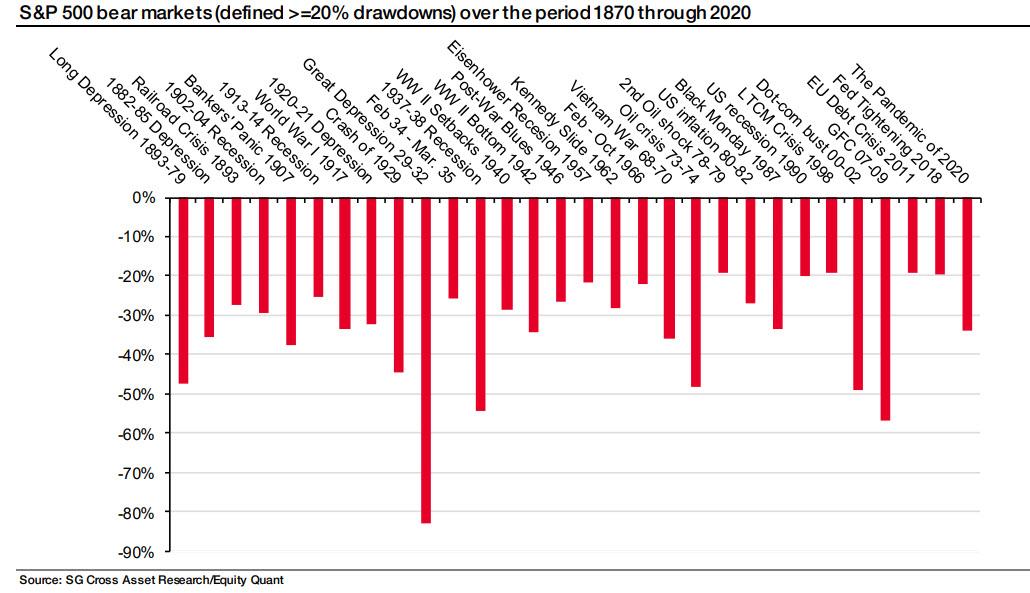
And while moves of such magnitude have been observed in the past, furious overshoots such as the current one tend to be – almost entirely – bear market rallies, because as Lapthonre notes, a look through the annals of market history and a study of bear markets in the last 150 years…
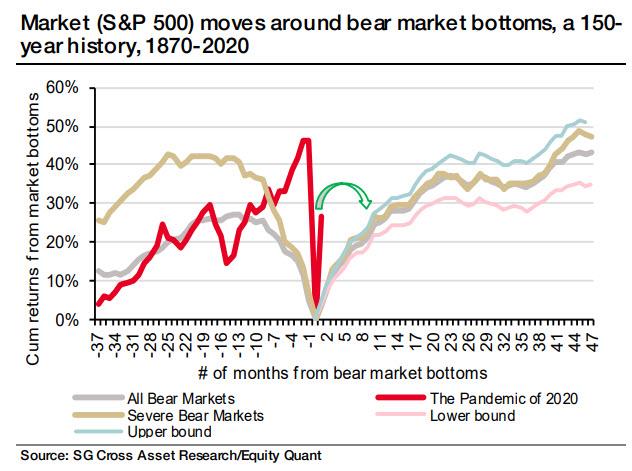
… reveals that “a return to recovery from a bear market bottom, both cyclical downturns and sudden market crashes, has often been gradual, with frequent adjustments along the way, reflecting the weight of uncertainty surrounding economic recovery out of the ashes of crises.“
In that respect, the ongoing surge in global markets strikes as an oddity (chart below) even after factoring in the massive bridges of support from monetary and fiscal stimulus.
As Lapthorne then points out, “based on an exhaustive analysis of bear markets of the last century and half, under the most conservative scenario – that the market has indeed reached cyclical bottom in the March sell-off – the S&P 500 would finish at about 2715 by year-end, a 7-8% cumulative correction from the current level of 2,939.”
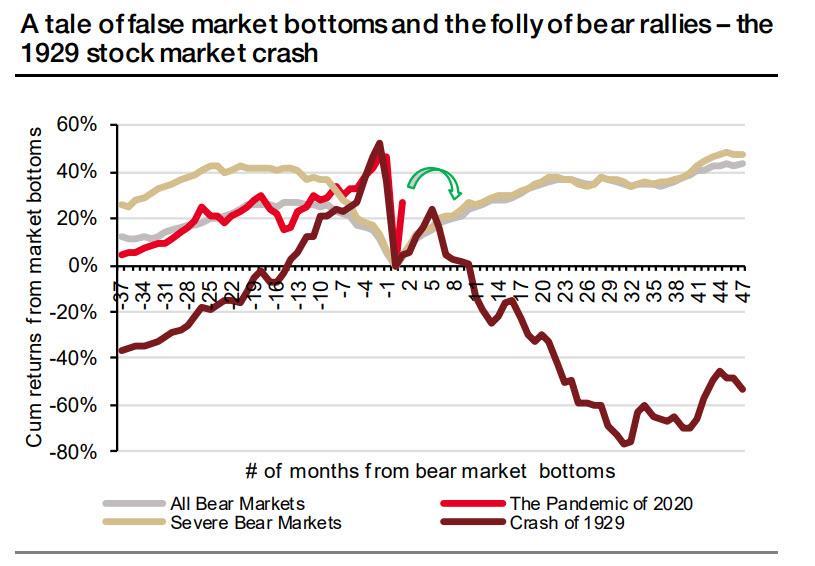
But wait, there’s more, because Andrew Lapthorne is not known for leaving things on a bullish note, and as he concludes, “the above analysis assumes critically that the 23 March bottom indeed reflects the cyclical bottom and assesses only the market’s speed of ascent during the eventual recovery. Yet, history is also replete with many instances of flimsy bear rallies that eventually succumbed to yet another, lower bottom” and reminds us of the “classic case” of the staggering 47% rally over the four months immediately after the bear bottom of the 1929 market crash. After peaking, the market then reversed its ascent in April 1930, and went through a harrowing tailspin of decline for the next two years until it hit its ultimate bottom in June of 1932 during the Great Depression, wiping out 83% of its value at the peak in April 1930.
His parting warning: “With the current fallout from the complete shutdown of economic life in terms of disruptions in supply chains and collapse of aggregate demand, as well as the uncertainty on the post-lockdown path to recovery, new market bottoms are possible, although the unprecedented massive policy response could provide the backstop to a worsening case of deflationary spiral.”
Tyler Durden
Tue, 05/12/2020 – 13:37


